Does time series (intrinsic or absolute) momentum work across asset classes prior to the Great Moderation (secular decline in interest rates)? In their August 2016 paper entitled “Trend Following: Equity and Bond Crisis Alpha”, Carl Hamill, Sandy Rattray and Otto Van Hemert test several time series momentum portfolios as applied to groups of bonds, commodities, currencies and equity indexes as far back as 1960. They consider 10 developed country equity indexes, 11 developed country government bond series, 25 agricultural/energy/metal futures series and nine U.S. dollar currency exchange rate series. They calculate return momentum for each asset as the weighted sum of its past monthly returns (up to 11 months) divided by the normalized standard deviation of those monthly returns. They then divide each signal again by volatility and apply a gearing factor to specify a 10% annual volatility target for each holding. Within each of equity index, bond and currency groups, they weight components equally. Within commodities, they weight agriculture, energy and metal sectors equally after weighting individual commodities equally within each sector. They report strategy performance based on excess return, roughly equal to real (inflation-adjusted) return. They commence strategy performance analyses in 1960 to include an extreme bond bear market. Using monthly price series that dovetail futures/forwards from inception with preceding spot (cash) data as available starting as early as January 1950 and as late as April 1990, all through 2015, they find that:
- Over the entire sample period, gross momentum returns based on individual monthly lags are:
- All positive for lags 1 through 12.
- Especially strong for lag 1 and relatively strong for lags 2, 3, 4, 9, 10 and 11.
- Relatively weak for lags 5 through 8 and 12.
- Mostly negative for lags 13 through 24.
- Since 1987 (with fewer assumptions about data), momentum returns based on individual monthly lags are especially strong for lags 1 and 11 and relatively strong for lags 2, 3, 9 and 10.
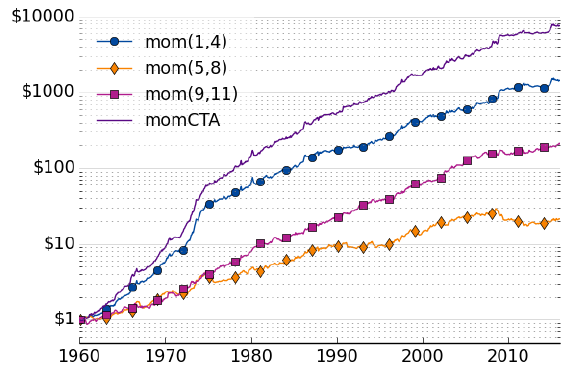
- Gross performance for multi-asset class portfolios with uniform 10% expected annual volatilities depends on momentum strategy specification (see the chart below). Specifically:
- Equally weighted past returns for lags 1 through 4, mom(1,4), is relatively strong.
- Equally weighted returns for lags 5 through 8, mom(5,8), is relatively weak.
- Equally weighted returns for lags 9 through 11, mom(9,11), is relatively strong.
- Weights across lags 1 through 11 selected for optimal tracking of the BTOP50 managed futures index, momCTA, is stronger than the prior three portfolios. These weights concentrate on lags 1, 2 and 3, and monthly returns are highly correlated with those of mom(1,4), suggesting that commodity traders ignore the useful signals from lags 9 through 11.
- All momentum portfolios perform consistently before and after 1985.
- Returns for mom(1,4) and momCTA are positively skewed.
- Performance of the momCTA strategy is particularly strong during both the worst and the best equity and bond markets.
The following chart, taken from the paper, compares on a logarithmic scale gross compounded excess returns of the four multi-asset class momentum portfolios specified above over the entire sample period. Performance is strongest for momCTA, tracked fairly closely by mom(1,4), both consistent with underreaction to news. The steady and relatively attractive performance of mom(9,11) is perhaps partly due to annual seasonality/reporting effects. Gross annualized Sharpe ratios for the four portfolios are, as listed, 1.30, 0.64, 1.12 and 1.56. Restricting the four portfolios to single asset classes shows that bonds drive the outperformance of mom(1,4) relative to mom(9,11).
In summary, evidence indicates that asset class intrinsic momentum effects are consistent before and after 1985, and that effects concentrate in past returns for monthly lags 1, 2, 3, 9, 10 and 11.
Cautions regarding findings include:
- Early data (when there is no futures market) does not include market reactions to trading. Moreover, analyses of some asset classes are unbalanced since class members have different inception dates.
- Reported performance data are gross, not net. Accounting for portfolio reformation frictions would reduce reported returns. Per the authors: “…we ignore transaction costs and fees, which would impact the general profitability… Assuming a two basis point transaction cost for outright trades leads to a reduction in the annualized return of 0.42% for [momCTA]…” However, markets with such frictions are not available over the entire sample period.
- Selection of momCTA weights across lags is in-sample. An investor operating in real time could not know these weights during the sample period.
- Running different versions of the momentum strategy on the same data introduces snooping bias, such that performance of the best version overstates expectations. The intricate weighting of past returns by monthly lag for momCTA introduces considerable latitude for snooping weights. Testing across subperiods mitigates this concern.
- The portfolio construction/implementation process is too complex for many investors, who would bear fees for delegating to an investment manager.
See also related past research on intrinsic momentum across asset classes, including some applied to exchange-traded products.