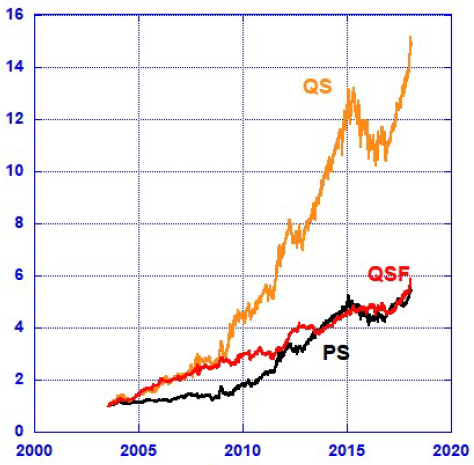
Does adding international equity exposure and an escape to “cash” enhance performance of a relative momentum strategy that switches between stock and U.S. Treasury bond exchange-traded funds (ETF)? In his February 2018 paper entitled “Simple and Effective Market Timing with Tactical Asset Allocation Part 2 – Choices”, Lewis Glenn updates and considers two extensions to a strategy summarized in “Simplest Asset Class ETF Momentum Strategy?” that each month holds SPDR S&P 500 (SPY) or iShares Barclays 20+ Year Treasury Bond (TLT) depending on which has the higher total return over the last three months. Specifically, the three strategies are:
- Pair Switching (PS) – the original strategy as described above.
- Quint Switching (QS) – adds iShares MSCI EAFE (EFA), PowerShares QQQ (QQQ) and iShares MSCI Emerging Markets (EEM) to the asset universe, each month picking the top performer.
- Quint Switching Filtered (QSF) – modifies QS by adding a rule that if any of SPY, TLT, EFA, QQQ and EFA have non-positive returns over the lookback interval, switch to iShares Barclays 7-10 Year Treasury (IEF) .
For all strategies, he includes 0.1% switching frictions for each buy and sell action. He focuses on compound annual growth rate (CAGR) and maximum drawdown (DDDmax) as key strategy performance metrics. He considers momentum ranking (lookback) intervals of 1 to 5 months to determine the optimal interval for the two strategy extensions. Using monthly dividend-adjusted closes of the specified funds during April 2004 through January 2018, he finds that:
- For PS, the updated CAGR is 11.7% and DDDmax is -21.9%.
- For the QS enhancement:
- Optimal lookback interval is clearly three months, with sharply higher CAGR and shallower DDDmax than intervals of one, two, four or five months.
- For a 3-month lookback interval, CAGR is 20.3% and DDDmax is -22.3%.
- For the QSF enhancement, also using a 3-month lookback interval, CAGR is 12.8% and DDDmax is -15.4%.
The following chart, taken from the paper, compares cumulative values of $1 initial investments in April 2004 in each of PS, QS and QSF. QS strongly outperforms PS based on CAGR, while QSF suppresses drawdowns compared to PS.

In summary, evidence suggests that broadening the equity universe and including a safe haven from multi-class declines may enhance the performance of a very simple stocks-bonds relative momentum strategy.
Cautions regarding findings include:
- A sample period of 13+ years is short in terms of variety of market conditions.
- Lookback interval optimization is in-sample, impounding look-ahead bias. The optimal lookback interval for QS sharply outperforms other intervals, suggesting a very lucky choice (strong data snooping bias) unlikely to perform so well out-of-sample. (See “Avoiding or Mitigating Snooping Bias”.)
- Backtesting three strategies on the same sample impounds additional data snooping bias.
- Execution of switches apparently takes place at the same close as momentum measurements, requiring slight anticipation of switching signals.
- Interest rates mostly decline over most of the sample period, representing a favorable environment for TLT and IEF (positive capital gains). IEF carries substantial term risk and may perform poorly, and still be chosen by the strategy, when interest rates are rising.
See also the Momentum Strategy (SACEMS) and associated research.