Generalizations from the body of equity price trend research are: (1) stocks tend to exhibit short-term reversal, intermediate-term momentum and long-term reversion; and, (2) small capitalization and high-volatility stocks tend to exhibit the strongest momentum. What about the combination of size and volatility? In the September 2010 version of his paper entitled “Do Momentum and Reversals Coexist?”, Jason Wei investigates how momentum and reversal effects for individual stocks vary jointly with market capitalization and volatility. He forms portfolios monthly based on sequential size, realized volatility and past return sorts. He considers quintile ranking and holding periods of one, two, three, six and 12 months, with an intervening skip-week. Using daily price data for a broad sample of NYSE/AMEX/NASDAQ stocks spanning 1964-2009, he finds that:
- For the entire sample and sample period, there is little evidence of a one-month return reversal, and the generally positive relationship between past and future returns is not monotonic.
- Small stocks do not exhibit statistically significant reversal for any combination of volatility and horizon.
- Large stocks with low (high) return volatility exhibit reversal (momentum) over horizons of one to three months. For stocks exhibiting reversal, reversal intensity decreases as the sum of evaluation and holding periods increases.
- All combinations of size and volatility exhibit momentum at the 12-month horizon.
- Results are robust to subperiods, using three-factor (market, size, book-to-market) alphas rather than raw returns, using idiosyncratic rather than total return volatility, excluding January returns and various size partitions.
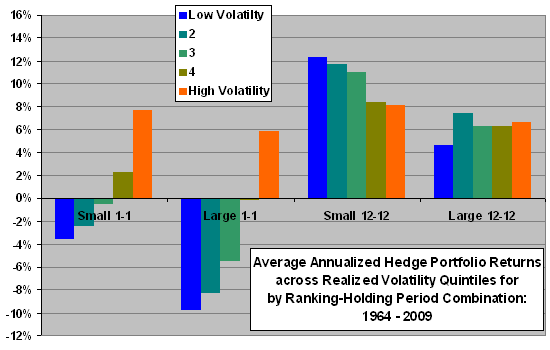
The following chart, constructed from data in the paper, shows the average annualized returns for four winner-minus-loser hedge portfolios formed monthly over the entire 1964-2009 sample period by sorting stocks first into small or large capitalization, then into quintiles of ranking period realized volatility and then into quintiles of ranking period return. The four portfolios are:
- Small 1-1: stocks with less than median market capitalization based on one-month ranking and holding periods.
- Large 1-1: stocks with greater than median market capitalization based on one-month ranking and holding periods.
- Small 12-12: stocks with less than median market capitalization based on 12-month ranking and holding periods.
- Large 12-12: stocks with greater than median market capitalization based on 12-month ranking and holding periods.
Results indicate that the short-term reversal effect is strongest for large stocks with low realized volatility and that 12-month momentum exists across ranges of size and realized volatility.

In summary, evidence indicates that investors may be able to refine short-term reversal and intermediate-term momentum strategies for individual stocks by considering market capitalization and ranking period return volatility jointly.