What drives the momentum effect among individual U.S. stocks? In their June 2012 paper entitled “Momentum, Risk, and Underreaction”, Mark Rachwalski and Quan Wen investigate the sources of profits for momentum strategies applied to individual stocks. They measure momentum profitability as average monthly returns to three series of equal-weighted hedge portfolios that each month are long (short) the tenth of stocks with the highest (lowest) returns over the previous three (3-1-1), six (6-1-1), and 12 (12-1-1) months, with a skip-month between ranking intervals and return measurement months to avoid short-term reversal. They test dependence of momentum profitability on five factors: (1) long-term idiosyncratic volatility (IV), the standard deviation of individual stock returns unexplained by the Fama-French model based on daily data from five years ago to six months ago; (2) short-term IV, based on daily data from six months to one week ago; (3) long-term distress risk (corporate default probability) based on daily data from five years ago to six months ago; (4) short-term distress risk based on daily data from six months to one week ago; and, (5) corporate bond beta relative to the BAA yield based on the last two years of daily data. Using daily return data for a broad sample of U.S. stocks, firm accounting information related to default probabilities and corporate bond yield data supporting analysis for 1988 through 2010, they find that:
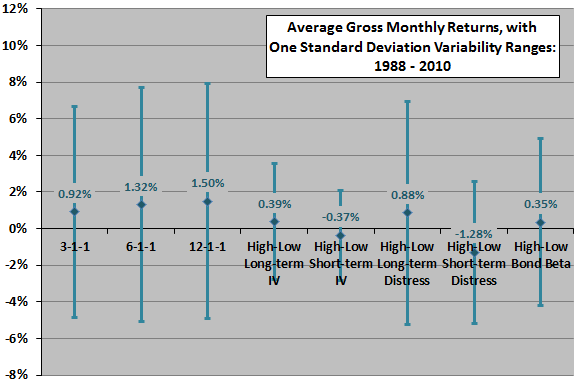
- Average gross monthly returns for the 3-1-1, 6-1-1 and 12-1-1 momentum strategies are 0.92%, 1.32% and 1.50%, respectively (see the chart below). The Fama-French three-factor (market, size, book-to-market) model does not explain momentum returns, generating respective gross alphas of 1.11%, 1.33% and 1.76%.
- Consistent with reward-for-risk, hedge portfolios that are long (short) the tenth of stocks with the highest (lowest) long-term IV, long-term distress and bond beta generate positive average returns. Consistent with investor underreaction, hedge portfolios that are long (short) the tenth of stocks with the highest (lowest) short-term IV and short-term distress generate negative average returns. (See the chart below.)
- Together, the five IV, distress and bond beta factors fully explain momentum profits. For example, regressing 12-1-1 momentum returns against all five factors explains all but 0.03% of the 1.5% average gross monthly return. Specifically, momentum portfolios tend to:
- Buy stocks with high long-term IV, long-term distress and bond risk, earning positive returns as compensation for risk.
- Sell stocks with high short-term IV and short-term distress risk, benefiting from their poor performance as investors slowly realize risk elevation.
- Momentum profitability and the explanatory power of the five risk factors increases as the return ranking interval increases, consistent with longer samples increasing precision of risk measurements.
- Extension of the sample period backward to 1977 and 1968 by progressively omitting bond beta and distress factors (due to data unavailability) indicates that the remaining risk factors still explain part of momentum returns.
- However, the five risk factors do not substantially explain long- term reversal of momentum.
The following chart, constructed from data in the paper, summarizes average gross monthly returns and return variabilities for the three momentum strategies and the five risk factors that explain momentum returns. Multi-factor regression indicates that momentum portfolios tend to go long (short) the three (two) risk factors with positive (negative) average gross monthly returns. The negative returns for the short-term risk factors are consistent with slow investor reactions to new information.

In summary, evidence indicates that a combination of risks associated with idiosyncratic volatility, firm distress and firm bond risk may explain why momentum works for individual U.S. stocks.
Cautions regarding findings include:
- Reported returns are gross, not net. Including reasonable trading frictions associated with monthly portfolio turnover (which tends to be high for equally weighted momentum portfolios rebalanced monthly) would materially reduce these returns.
- Experimentation with factors, factor measurement parameters and factor combinations as potential drivers of momentum profitability (both within a given study and across the body of published research) may introduce material data snooping bias, overstating the explanatory power of the best combination discovered.
- Per tests on exchange-traded funds related to “Simple Sector ETF Momentum Strategy”, “Doing Momentum with Style (ETFs)” and “Simple Asset Class ETF Momentum Strategy”, longer momentum ranking intervals generally do not outperform shorter ones in recent samples.