
Do momentum and reversal stock anomalies stripped of market, size and book-to-market risks (residual anomalies) outperform their conventional forms? In their March 2017 paper entitled “Residual Momentum and Reversal Strategies Revisited”, Joop Huij and Simon Lansdorp compare performances of residual and conventional momentum (using returns from 12 months ago to one month ago) and reversal (using last-month returns) strategies for U.S., European, Japanese, Asia-Pacific and emerging market stocks. They calculate anomaly performance from portfolios that are each month long (short) the equally weighted fifth, or quintile, of stocks with the highest (lowest) expected momentum and reversal returns. To check robustness, they focus on tests segmented into a residual anomaly discovery subperiod (January 1986 through December 2008) and a recent subperiod (January 2009 through December 2015). Using monthly returns as available (only since January 1993 for emerging markets) for the specified stocks, they find that:
- During 1986-2008 for U.S. stocks:
- Average gross annual return for residual (conventional) momentum is 13.1% (16.1%) with annual volatility 10.3% (21.6%). The gross annual return-to-risk ratio is therefore 1.28 (0.74).
- Average gross annual return for residual (conventional) reversal is 11.1% (4.4%) with annual volatility 9.4% (19.9%). The gross annual return-to-risk ratio is therefore 1.18 (0.22).
- During 1986-2008 for stocks in non-U.S. markets:
- Gross annual reward-to-risk ratios are consistently higher for residual than conventional momentum in all markets.
- Gross annual reward-to-risk ratios are consistently higher for residual than conventional reversal in all markets, though unattractive in some markets for residual reversal and nearly all markets for conventional reversal.
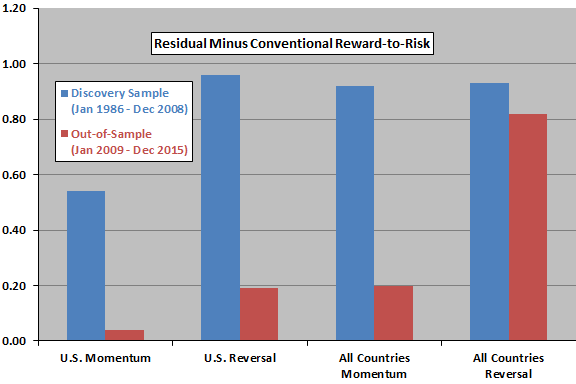
- During 2009-2015 (see the chart below):
- Gross annual reward-to-risk ratios are consistently higher for residual than conventional momentum in all markets, but both are unattractive for U.S. stocks.
- Gross annual reward-to-risk ratios are consistently higher for residual than conventional reversal in all markets, with conventional reversal generally unattractive.
- In 2009 (market rebound), residual momentum strongly outperforms conventional momentum in all markets, with gross annual return differences ranging from 25% to 40%. Conventional momentum generally outperforms residual momentum in subsequent (trending) years.
The following chart, constructed from data in the paper, compares gross annual residual-minus-conventional reward-to-risk ratio differences for momentum and reversal strategies in the U.S. alone and across all countries during the discovery sample subperiod (1986-2008) and an out-of-sample subperiod (2009-2015). Results consistently show that residual momentum and reversal outperform their conventional counterparts on a gross, risk-adjusted basis, though out-of-sample outperformance is mostly modest.
In summary, evidence indicates that residual momentum and reversal suppress volatility compared to their conventional counterparts and thereby achieve higher gross return-to-risk ratios in different stock markets and in recent data.
Cautions regarding findings include:
- Results are gross, not net. Accounting for monthly portfolio reformation and shorting costs would reduce anomaly performances. Shorting as specified may be costly or infeasible due to lack of shares to borrow. Costs and constraints may vary considerably across markets.
- The process of purifying momentum and reversal positions of dependence on market, size and book-to-market factors is beyond the reach of most investors, who would bear fees for delegating to an investment/fund manager.
See “Purified Short-term Stock Reversal” and “Stripping Risks from a Stock Momentum Strategy” for summaries of some of the original research. See also “Purified Stock Momentum with Crash Suppression” and “Suppressing Unrelated Risks from Stock Factor Portfolios”.
Frequently Asked Questions
What is residual momentum in stock investing?
Residual momentum is a stock momentum strategy that strips out exposure to market, size and book-to-market risks before ranking stocks on past returns. Conventional momentum ranks stocks on returns from 12 months ago to one month ago, and the residual version applies the same idea to the returns left after those factor effects are removed.
Do residual momentum and reversal strategies outperform conventional ones?
Residual momentum and reversal strategies outperformed their conventional counterparts on a gross, risk-adjusted basis. For U.S. stocks in 1986-2008, the return-to-risk ratio was 1.28 for residual versus 0.74 for conventional momentum, and 1.18 versus 0.22 for reversal. Outperformance held across markets and in 2009-2015, though out-of-sample gains were mostly modest.
How are residual momentum and reversal portfolios constructed and tested?
Residual momentum and reversal portfolios are built each month by going long the equally weighted quintile of stocks with the highest expected momentum or reversal returns and short the quintile with the lowest. Market, size and book-to-market effects are removed from the signals. Performance was tested for U.S., European, Japanese, Asia-Pacific and emerging market stocks, split into a 1986-2008 discovery period and a 2009-2015 recent period.
How does residual momentum differ from conventional momentum in returns and volatility?
Residual momentum had lower gross returns but far lower volatility than conventional momentum for U.S. stocks in 1986-2008: 13.1% return with 10.3% volatility versus 16.1% with 21.6%. This volatility suppression produced the higher return-to-risk ratio. In 2009, residual momentum beat conventional momentum by 25% to 40% annually in all markets, while conventional momentum generally did better in subsequent trending years.
What are the limitations of residual momentum and reversal strategies?
The reported residual momentum and reversal results are gross, not net, so monthly portfolio reformation and shorting costs would reduce performance. Shorting may be costly or infeasible due to lack of shares to borrow, and costs and constraints vary across markets. Purifying positions of market, size and book-to-market exposure is beyond the reach of most investors, who would pay fees to delegate it to a manager.