
Does interest in, or concern about, financial markets as expressed in Internet searches predict stock market behavior? In the December 2014 revision of their paper entitled “Can We Predict the Financial Markets Based on Google’s Search Queries?”, Marcelo Perlin, Joao Caldeira, Andre Santos and Martin Pontuschka investigate whether changes in Google search frequency for finance-related words predict changes in stock market index level, volatility and trading volume in four English speaking countries (U.S., UK, Australia and Canada). They select 15 relevant search words/terms by measuring the frequency of appearance in four finance textbooks of a large number of candidates from an online financial dictionary. They then use Google Trends to construct time series of relative search frequency (on a scale of 0 to 100) for the selected words/terms in each of the four countries and relate these series to respective country stock market behaviors. Finally, they test a timing strategy that is each week long or short an index depending on level of local Google Trends search activity. Using the search activity time series and daily levels and constituent trading volumes for major stock market indexes in the four countries (aggregated weekly) during January 2005 through December 2013, they find that:
- Several words exhibit statistically meaningful power to predict stock market behaviors.
- The strongest result is that an increase in search activity for the word “stock” predicts an increase in index volatility and decrease in index level the next week.
- Results for 14,639 randomly selected words confirm that “stock” likely has predictive power.
- The weekly market timing strategy based on “stock” search frequency outperforms a buy-and-hold strategy on a gross basis in all four stock markets (see the chart below).
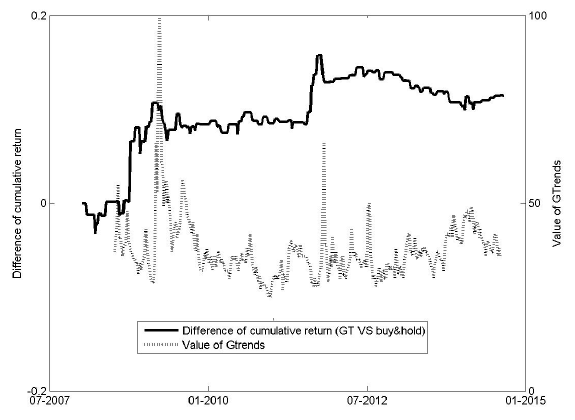
The following chart, taken from the paper, tracks the gross cumulative difference in weekly S&P 500 Index log returns (left axis and dark line) between the Google Trends (GT) timing strategy using the word “stock” and buying and holding the index. It also shows the Google Trends relative search frequency for “stock” (right axis and light line). Results indicate that:
- Gross outperformance of the timing strategy concentrates during a few brief episodes that appear to coincide with unusual stock market weakness.
- The rest of the time, the timing strategy appears to be ineffective.
Note that during episodes of stock market weakness, random market timing outperforms buy-and-hold. Also, accounting for weekly trading frictions/shorting costs would reduce the outperformance of the Google Trends timing strategy.
In summary, evidence that Google Trends search activity for certain financial words usefully predicts stock market behavior is unconvincing.
Cautions regarding findings include:
- As noted, strategy performance calculations are gross, not net. Including reasonable trading frictions and shorting costs would reduce strategy performance.
- As noted, strategy outperformance relative to buy-and-hold appears to concentrate during brief episodes of unusual market weakness, during which times random timing would generally beat buy-and-hold. Such periods of “wildness” may drive substantially non-normal return distributions that complicate determination of statistical significance.
- As noted in the paper, Google Trends offers only a short history for testing.
- There may be snooping bias in the Google Trends activity threshold for determining whether to be long or short the stock market index. Snooping bias may be elevated when a few episodes drive results.
Frequently Asked Questions
What is Google Trends search frequency and how is it used in finance research?
Google Trends search frequency is a time series of the relative popularity of a search word or term, scaled from 0 to 100, within a given country. In the research reviewed, it was built for 15 finance-related words in the U.S., UK, Australia and Canada to test whether investor interest or concern predicts stock index level, volatility and trading volume.
Does Google search activity for the word "stock" predict stock market returns?
Google search activity for the word "stock" showed some predictive power: higher search activity predicted higher index volatility and a lower index level the following week during 2005–2013. A weekly timing strategy based on it beat buy-and-hold on a gross basis in all four markets, but the overall evidence that Google Trends usefully predicts stock market behavior is unconvincing.
How is a Google Trends stock market timing strategy tested?
The Google Trends timing strategy is tested by going long or short a stock index each week depending on the local level of Google Trends search activity for a word such as "stock." Researchers used weekly-aggregated index levels and trading volumes for the U.S., UK, Australia and Canada from January 2005 through December 2013, and compared results against buy-and-hold and against 14,639 randomly selected words.
How does a Google search-based timing strategy compare to buy-and-hold or random market timing?
The Google Trends timing strategy using "stock" beat buy-and-hold on a gross basis in all four markets, but the outperformance concentrated in a few brief episodes of unusual market weakness. During such episodes random market timing also outperforms buy-and-hold, and outside them the Google strategy appears ineffective.
What are the limitations of using Google Trends to predict stock market returns?
Google Trends timing results are gross of trading frictions and shorting costs, which would reduce outperformance from weekly rebalancing. Gains concentrate in a few brief market-weakness episodes that can create non-normal returns and complicate significance testing, Google Trends offers only a short history, and the long/short search-activity threshold may carry snooping bias.