Does Google search activity anticipate stock market action? In their paper entitled “Quantifying Trading Behavior in Financial Markets Using Google Trends”, Tobias Preis, Helen Susannah Moat and Eugene Stanley analyze the power of changes in Google search intensity (term search volume relative to total Google search volume) for 98 terms to predict the behavior of the Dow Jones Industrial Average (DJIA). They apply Google Trends to measure each week the average search intensity for a term over the prior three weeks. They then measure changes in this weekly average search intensity relative to its average behavior over several weeks (with three weeks as baseline). They test a trading strategy that sells (buys) DJIA at the close on the first trading day of the next week if the change in weekly search term intensity is negative (positive) and exits the position at the close on the first trading day of the following week. They consider three benchmarks based on DJIA: (1) buy-and-hold; (2) random weekly timing; and, (3) an index reversion strategy with rules similar to the search intensity strategy. They ignore trading frictions, which involve a maximum of 104 one-way trades per year. Using weekly search intensity data for the specified search words and weekly DJIA closing levels as specified during January 2004 through most of February 2011, they find that:
- In general, decreases (increases) in search intensity for certain financial terms tend to precede advances (declines) in DJIA.
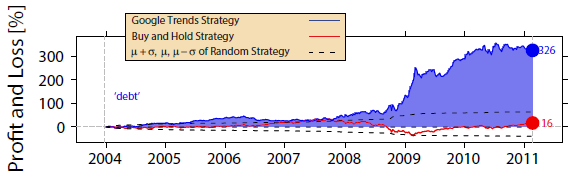
- Based on gross cumulative returns across search terms, the Google Trends strategy significantly outperforms buy-and-hold, random timing and the index reversion strategy. The best-performing search term is “debt” (see the chart below).
- Both the long and short trades contribute to Google Trends strategy profitability.
- The return associated with an individual search term relates positively to its financial relevance based on frequency of occurrence in the online edition of the Financial Times during August 2004 through June 2011.
- Extending the scope of search intensity from U.S. to global users reduces its effectiveness for DJIA trading.
The following chart, taken from the paper, compares the the gross cumulative return of the Google Trends strategy for the optimal search term “debt” (blue line) to that of buy-and-hold (red line) and a range of one standard deviation above and below the mean for 10,000 random weekly timing runs (dashed black lines). The 326% gross gain for exploiting “debt” search intensity far exceeds the benchmarks.
However, since “debt” is one of 98 search terms, its performance impounds considerable data snooping bias. Trading frictions would also materially reduce performance of the Google Trends strategy. Also, the gain concentrates during the financial crisis, suggesting that it may not repeat.
In summary, evidence suggests that traders may be able to exploit aggregate investor sentiment toward risky investments as measured by Google Trends search intensity for relevant words.
Cautions regarding findings include:
- As noted, the study ignores trading frictions. Compounding even a low trading friction 104 times results in substantial cumulative friction. For example, 0.1% (0.2%) compounds to an 11% (23%) annual drag.
- The study also ignores shorting costs and dividends, to the disadvantage of a buy-and-hold benchmark.
- As noted, trying 98 search terms impounds considerable data snooping bias. Results for the best-performing search term (“debt”) therefore likely overstates reasonable expectation of its out-of-sample performance. Search terms tried and subsequently discarded/unreported, if any, would increase data snooping bias.
- There is also potential for data snooping in the selection of interval lengths for the averaging weekly search intensity and comparison of weekly search intensity to its historical level.