For what types of stocks is sentiment trading most likely to work? In the June 2008 update of their paper entitled “How Does Investor Sentiment Affect the Cross-Section of Stock Returns?”, Malcolm Baker, Johnathan Wang and Jeffrey Wurgler investigate returns for different types of stocks in the context of broad investor sentiment index derived from principal component analysis of six indicators: trading volume as measured by NYSE turnover; the dividend premium; the closed-end fund discount; the number of, and first-day returns on, Initial Public Offerings; and the equity share in new issues. Using this sentiment index and monthly stock return and characteristics data for 1962-2005, they conclude that:
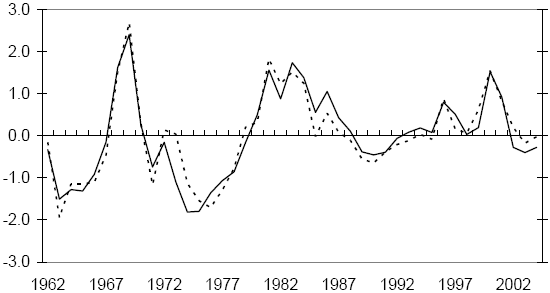
- Historically, fluctuations in the sentiment index map reasonably well to broad stock market trends (see the chart below).
- When sentiment is low (high), stocks that are prone to speculation and difficult to arbitrage (young, small, unprofitable, non-dividend-paying, volatile, distressed and extreme growth) tend to earn relatively high (low) subsequent returns.
- For example, based on differences in returns for extreme tenths of stock sorts:
- When sentiment is low (high), the smallest stocks outperform the largest by an average 1.25% (0.27%) per month.
- When sentiment is low (high), the youngest stocks outperform (underperform) the oldest by an average 0.38% (0.55%) per month.
- When sentiment is low (high), the most volatile stocks outperform (underperform) the least volatile by an average 1.00% (0.55%) per month.
The following chart, taken from the paper, shows the behavior of the aggregate sentiment index derived from the six sentiment indicators listed above over the period 1962-2005. The solid line is the raw index, and the dashed line adjusts the index for business cycle conditions.

In summary, low (high) investor sentiment is especially indicative of future outperformance (underperformance) by the most speculative stocks.