
Can traders exploit the essential price-moving sentiment expressed in news articles about stocks? In their August 2013 paper entitled “News versus Sentiment: Comparing Textual Processing Approaches for Predicting Stock Returns”, Steven Heston and Nitish Sinha compare the abilities of two different word sentiment dictionaries and a sophisticated neural network to predict stock returns by analyzing news sentiment. Specifically, they use the Harvard General Inquirer Psychosocial Dictionary, the Loughran-McDonald financial dictionary and the proprietary Thomson-Reuters neural network to measure whether news expresses positive, neutral or negative sentiment about associated stocks. They focus on net stock sentiment (positive minus negative) expressed by all relevant articles published over one trading day or one week. They measure predictive power via the difference (in excess of the risk-free rate) between the average future gross returns of the fifths (quintiles) of stocks with the highest and lowest net sentiments. Using the specified sentiment analysis tools and a set of 900,754 Reuters news articles published during 2003 through 2010, they find that:
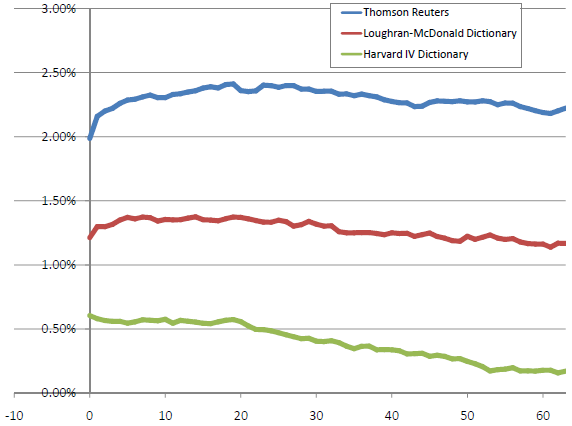
- For daily news sentiment measurements, stocks with positive (negative) news have predictably high (low) returns only over the next 1-2 days that largely reverse. Specifically (see the first chart below):
- The Harvard dictionary produces an average publication day long-short excess return of 0.61% but does not predict future returns.
- The Loughran-McDonald dictionary produces an average publication day long-short excess return of 1.21% and predicts a gross average return of 0.08% the next day.
- The Thomson-Reuters neural network produces an average publication day long-short excess return of 1.99% and predicts a gross average return of 0.17% the next day and 0.04% the day after.
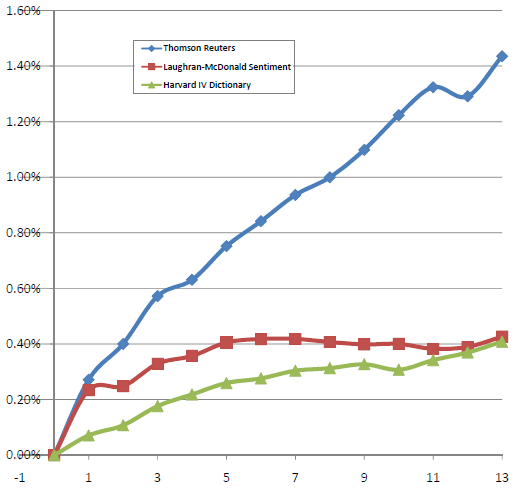
- For weekly news sentiment measurements, stocks with positive (negative) news have predictably high (low) returns over the next 13 weeks that do not reverse. Specifically (see the second chart below):
- The Harvard dictionary produces an average publication week long-short excess return of 1.21% but does not predict future returns.
- The Loughran-McDonald dictionary produces an average publication week long-short excess return of 2.20% and predicts an average gross return of 0.33% the next week. Returns are positive for 11 of the subsequent 12 weeks, but are not statistically significant.
- The Thomson-Reuters neural network produces an average publication week long-short excess return of 3.75% and statistically significant positive returns for the next 13 weeks. After the first week, the short side of the portfolio (negative sentiment stocks) drives returns.
The following chart, taken from the paper, shows average cumulative gross excess returns over 63 trading days for portfolios that are long (short) the quintile of stocks with the most positive (negative) daily news sentiment across the entire sample period. Day 0 is the news measurement date. All three sentiment analysis tools generate large same-day (unexploitable) gross positive returns, increasing with the sophistication of the tool. With respect to future returns, only the Thomson-Reuters neural network appears potentially exploitable.
The next chart, also from the paper, shows average cumulative gross excess returns over 13 weeks for portfolios that are long (short) the quintile of stocks with the most positive (negative) weekly news sentiment over the entire sample period. Week 0 is the news measurement week (returns not shown). Exploitability appears most likely for the Thomson-Reuters sentiment analysis tool, with a positive gross return of over 1.4% during the quarter after portfolio formation.
In summary, evidence indicates that more complex news sentiment analysis tools (such as the Thomson-Reuters neural network) predict larger, more lasting gross stock returns than do simpler sentiment measurement tools.
Cautions regarding findings include:
- Reported returns are gross, not net, not accounting for:
- Trading frictions (broker fees, bid-ask spreads and perhaps impact of trading).
- Cost/feasibility of shorting the negative-sentiment stocks (especially of concern since the short side of the portfolio dominates weekly sentiment portfolio performance during weeks 2-13).
- Costs of obtaining a comprehensive news feed and licensing sophisticated news analysis software.
- News collection and sentiment processing times may preclude initiating trades as assumed at contemporaneous daily closes and thereby diminish exploitability.
- The sample period is not long in terms of market/news environment evolution.
Frequently Asked Questions
What is news sentiment analysis in stock return prediction?
News sentiment analysis in stock return prediction is the process of classifying news articles about a stock as positive, neutral or negative and using the net sentiment (positive minus negative) to forecast returns. In the Heston and Sinha study, net sentiment was aggregated across all relevant articles published over one trading day or one week. Tools range from word dictionaries to neural networks.
Does news sentiment predict future stock returns?
News sentiment does predict future stock returns, but mainly when measured with a sophisticated tool. Using 900,754 Reuters articles from 2003 to 2010, the Thomson-Reuters neural network produced a 3.75% weekly long-short excess return and significantly positive returns for the next 13 weeks. The Harvard dictionary did not predict future returns, and daily sentiment effects lasted only 1-2 days and largely reversed.
How is the predictive power of news sentiment measured with quintile portfolios?
Predictive power of news sentiment is measured by ranking stocks into fifths (quintiles) by net sentiment and comparing the average future gross returns of the highest and lowest quintiles, in excess of the risk-free rate. Net sentiment is positive minus negative sentiment across all relevant articles over one day or one week. The study applied the Harvard dictionary, the Loughran-McDonald dictionary and the Thomson-Reuters neural network to Reuters articles from 2003 to 2010.
How do neural networks compare to sentiment dictionaries like Loughran-McDonald for analyzing financial news?
A neural network (Thomson-Reuters) outperformed sentiment dictionaries for analyzing financial news in the Heston and Sinha study. Weekly long-short excess returns were 3.75% for the neural network, 2.20% for the Loughran-McDonald financial dictionary and 1.21% for the Harvard dictionary. The neural network's predictive returns were also larger and more lasting, while the Harvard dictionary showed no predictive power.
What are the limitations of trading on news sentiment signals?
Trading on news sentiment signals faces limits because the reported returns are gross, ignoring broker fees, bid-ask spreads, trading impact, and the cost and feasibility of shorting negative-sentiment stocks. Short positions drive weekly portfolio performance in weeks 2-13, and news collection and processing delays may prevent trades at assumed closing prices. Costs of news feeds and software licensing are also unaccounted for, and the 2003-2010 sample is short relative to market and news environment evolution.