A reader asked: “Is there any tradable relationship between aggregate net money flows and market returns. I have read many articles pointing out how, according to money flows, investors got out at the bottom in 2008. Can flows into the equity market at large predict (or ‘inversely’ predict) returns?” To check, we relate return to the net money flow reported in the referenced Wall Street Journal data, focusing on the Dow Jones Industrial Average (DJIA). Using DJIA net money flows and DJIA returns at weekly and monthly intervals since May 2007 (the earliest available), we find that:
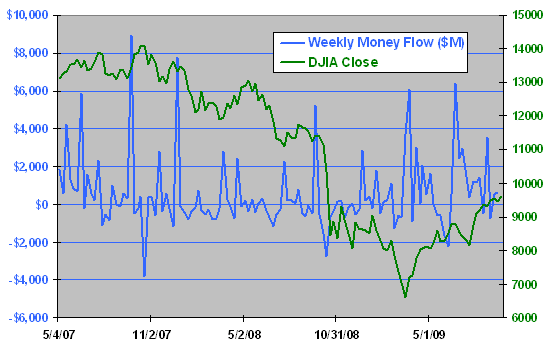
The following chart compares the weekly net money flows into DJIA and the contemporaneous levels of DJIA over the entire 124-week sample period. Visual inspection suggests that net money inflows (outflows) coincide with DJIA advances (declines). However, net money flow is very noisy.
For quantification, we relate money flow to stock returns.
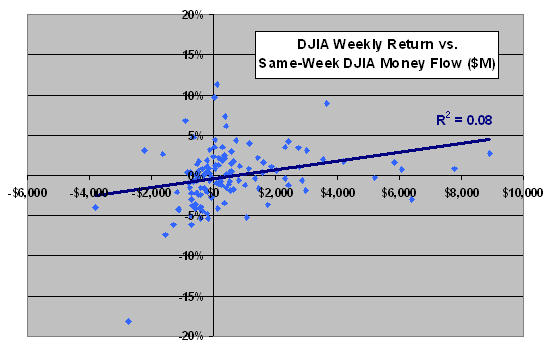
The following scatter plot relates the DJIA weekly return to same-week net money flow into DJIA over the entire sample period. The Pearson correlation for the relationship is 0.29, and the R-squared statistic is 0.08, indicating that variation in weekly net money flow explains 8% of same-week returns.
R-squared for the relationship between weekly net money flow into DJIA and next-week DJIA return is 0.00.
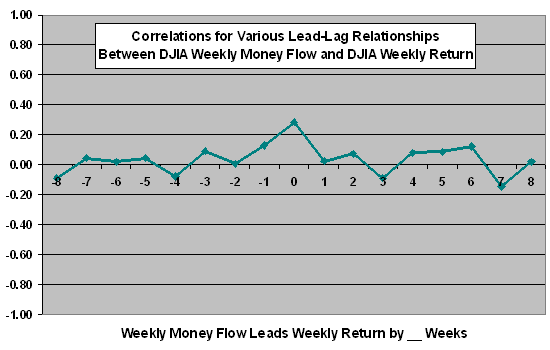
Is there any reliable lead or lag relationship between weekly return and weekly net money flow?
The next chart shows correlations between DJIA weekly return and weekly net money flow into DJIA over the entire sample period for lead-lag relationships ranging from stock return lead net money flow by eight weeks (-8) to net money flow leads stock return by eight weeks (8). The only noticeable relationship is the coincident one (0) plotted above.
Might the monthly relationship be more informative?
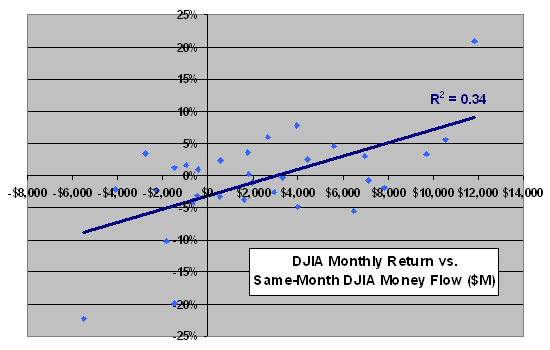
The following scatter plot relates the DJIA monthly return to same-month net money flow into DJIA over the entire 31-month sample period (selecting every fourth week from the dataset). The Pearson correlation for the relationship is 0.59, and the R-squared statistic is 0.34, indicating that variation in monthly net money flow explains 34% of same-month returns.
R-squared for the relationship between monthly net money flow into DJIA and next-month DJIA return is 0.00.
R-squared for the relationship between monthly net money flow into DJIA and next–week DJIA return is also 0.00.
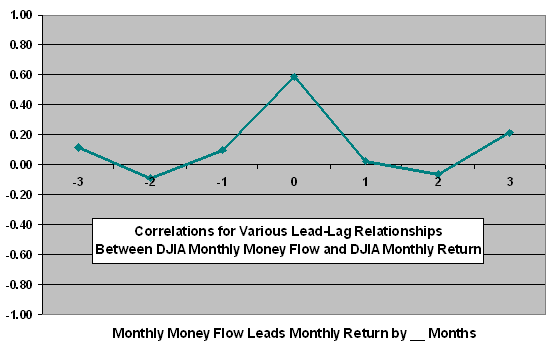
Is there any reliable lead or lag relationship between monthly return and monthly net money flow?
The final chart shows correlations between DJIA monthly return and monthly net money flow into DJIA over the entire sample period for lead-lag relationships ranging from stock return lead net money flow by three months (-3) to net money flow leads stock return by three months (3). Again, the only noticeable relationship is the coincident one (0) plotted above.
Intervals longer than one month might uncover some power of net money flow to predict stock market reversion, but the sample period is too short to support analysis of long-term relationships.
In summary, evidence from simple tests on a limited dataset do not support a belief that net money flow is usefully predictive of weekly or monthly stock market returns.