Does systematic measurement of the level of investor optimism provide a clue to the future direction of the stock market? Or, does investor sentiment merely respond to market ups and downs? UBS and Gallup conduct a monthly poll of American investors (“head of a household or a spouse in any household with total savings and investments of $10,000 or more”) to assess their aggregate level of optimism. Polling takes place during the first half of each month, with results reported near the end of the month. Comparing historical UBS/Gallup investor optimism data to contemporaneous monthly S&P 500 index over the period February 1999 through December 2007, we find that…
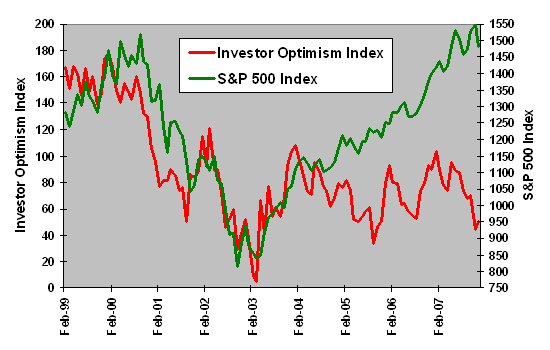
The following chart compares monthly behavior of the Investor Optimism Index and the S&P 500 index since February 1999. The stock market level for a given month is the close for the prior month (a level that all those polled could know). The coincident Investor Optimism Index is the result of polling over approximately the next two weeks. The poll results are therefore somewhat fresher than the stock market data, with many of those polled very likely aware of stock market movements after the opening for the month.
Visual inspection suggests a positive relationship between the two series. However, the the 2000-2002 bear market appears to have inoculated investors against irrational exuberance.
For a closer look at the relationship, we compare monthly changes in the two series.

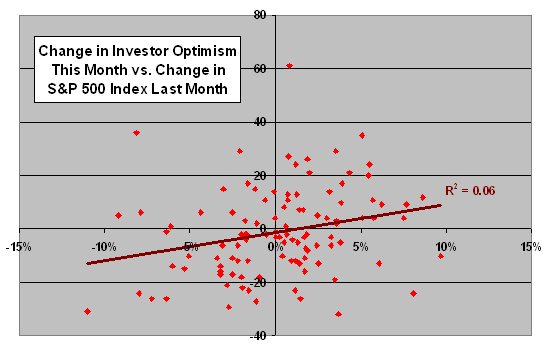
To gauge the impact of past stock market behavior on investor sentiment, the following scatter plot relates the monthly change in the Investor Optimism Index to the prior-month percentage change in the S&P 500 index. The Pearson correlation for these two series is a modest 0.25, and the R-squared statistic is just 0.06. Results suggest that movement of the market in the month before polling starts explains just 6% of the change in investor sentiment. However, those polled could be aware of continued market movements for up to an additional two weeks, so this inference is imperfect.
Do changes in the Investor Optimism Index predict stock market movements?

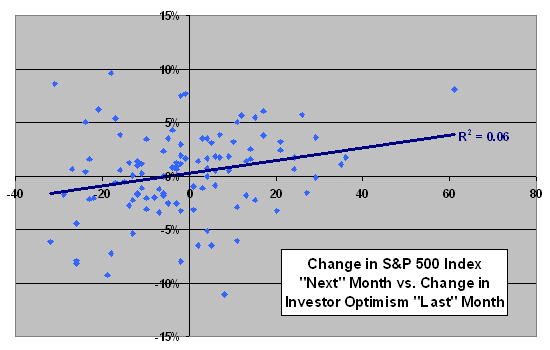
To gauge the predictive power of investor sentiment, the following scatter plot relates the “next”-month percentage change in the S&P 500 index to the monthly change in the Investor Optimism Index. The Pearson correlation this time is also 0.25, and the R-squared statistic is again 0.06. Results suggest that the change in investor sentiment from month to month explains 6% of the movement of the market during the next month. However, up to two weeks of stock market movement could already be known to the investors being polled, so this inference is contaminated with look-ahead bias.
To remove the bias, we ask whether changes in investor sentiment predict stock market behavior in the second half of each month after Gallup completes polling.

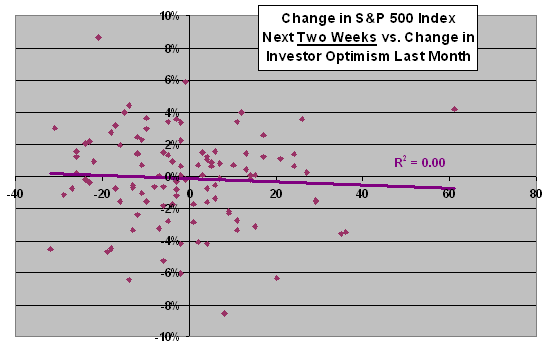
The final scatter plot relates the percentage change in the S&P 500 index during the second half of each month to the monthly change in the Investor Optimism Index. We define second half as the period from the 16th of each month (or the first trading day after the 16th) to the end of the month. This approach should eliminate the overlap between the stock market forecast period and the associated investor sentiment polling period. For example, the change in investor sentiment for December is the index level for December (surveyed by mid-December) minus the index level for November. We relate that sentiment delta to the change in the S&P 500 index during the second half of December. (In fact, UBS would not release the sentiment data until the end of December.)
The Pearson correlation for the de-biased sample is -0.06, and the R-squared statistic is 0.00. Results suggest that the change in investor sentiment from month to month explains none of the movement of the stock market during the next two weeks.

In summary, the UBS/Gallup Investor Optimism Index is modestly reactive to recent stock market behavior, but it has no predictive power for stock returns (even before its release to the public).