Is information technology moving in on qualitative event trading just as it has high-frequency quantitative algorithm trading? In the October 2011 version of their paper entitled “Event Driven Trading and the ‘New News'”, David Leinweber and Jacob Sisk examine the trading acumen of a model (set of filters) trained to exploit Thomson Reuters News Analytics metadata (sentiment tone, stock relevance and novelty as measured by link counts). Their portfolio simulation approach: (1) is restricted to the technology, industrials, health care, financials and basic materials sectors; (2) assumes an extreme sentiment day for a stock has at least four novel news items (prior to 3:30PM in New York) and is among the top 5% of average daily positive or negative events; (3) makes portfolio changes at market close; (4) holds positions for 20 days, subject to a 5% stop-loss rule and a 20% take-profit rule; (5) constrains any one position to 15% of portfolio value; and, (6) assumes round-trip trading friction of 0.25%. Using news metadata for the S&P 1500 and associated stock returns during 2003 through 2009 for in-sample testing and the first three quarters of 2010 for out-of-sample testing, they find that:
- In-sample testing indicates that:
- There is a trade-off in filter settings between number of signals generated and signal exploitability.
- Negative sentiment signals are more exploitable than positive signals.
- Signals for small and medium capitalization stocks are stronger than those for large capitalization stocks.
- Returns are volatile, with maximum drawdown about 60%. Mean monthly return is 1.7%, with 52% of months profitable.
- The filter models starts producing alpha in 2007 when the Thomson Reuters News Analytics metadata increases dramatically in terms of breadth, depth and volume.
- The largest alpha events cluster, such that many of the “alpha spikes” derive from short positions during the financial crisis when it was difficult or impossible to take these positions.
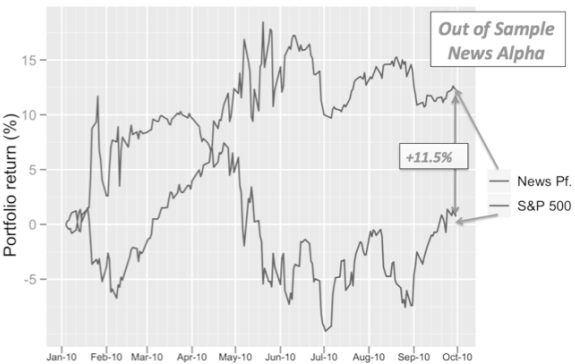
- During the nine-month out-of-sample test, a portfolio driven exclusively by the news metadata filter model beats the S&P 500 Index by a net 11.5% (see the chart below).
The following chart, taken from the paper, compares the out-of-sample cumulative trading performance of the news metadata filter model to that of the S&P 500 Index (apparently excluding dividends) during the first three quarters of 2010. During this period, the model generates a positive return and beats the index by 11.5%.

In summary, evidence indicates that traders may be able to beat the stock market by systematically filtering a broad and deep source of news metadata to identify sentiment extremes for individual stocks.
Cautions regarding findings include:
- The out-of-sample test period is short in terms of variety of market conditions.
- Tests apparently do not allocate any cost of using the Thomson Reuters News Analytics service to trading friction. This cost would reduce reported returns.
- Since smaller capitalization stocks apparently drive profitability and test portfolio allocation rules are not be based on market capitalization, the S&P 500 Index may not be an appropriate benchmark. For example, the total return for iShares S&P 1500 Index (ISI) during the first three quarters of 2010 is 4.2%, compared to 3.5% for S&P 500 SPDR (SPY). And, the total return for Rydex S&P 500 Equal Weight (RSP) during the first three quarters of 2010 is 8.1%.
- The assumed level of trading friction may be optimistic for many traders, especially during market crises or narrower crises specific to traded stocks.
- Market adaptation to widespread use of news metadata is plausible.