Is investor sentiment a better predictor of future stock returns in bull markets or bear markets? In their March 2010 paper entitled “When Does Investor Sentiment Predict Stock Returns?”, San-Lin Chung, Chi-Hsiou Hung and Chung-Ying Yeh examine the predictive power of investor sentiment for different kinds of stocks during bull (low-volatility, expansion) and bear (high-volatility, recession) equity market regimes. In each regime, they test the ability of a lagged multi-indicator sentiment index to forecast equally weighted hedge portfolio returns, focusing on stocks most likely susceptible to mispricing (small-capitalization stocks, stocks without positive earnings, growth stocks and stocks that pay no dividend). Using monthly returns for a broad sample of U.S. stocks and a value-weighted stock market index and investor sentiment data for the period 1966-2005, they find that:
- The investor sentiment index tends to be higher (lower) during bull (bear) market regimes.
- The sentiment index tends to lag market regime changes by some months, with high (low) sentiment persisting after a shift from bull (bear) to bear (bull) regime.
- The sentiment index exhibits strong in-sample and out-of-sample predictive power only for high sentiment during bull market regimes.
- This predictive power is strong for speculative stocks with highly subjective valuations (small-capitalization stocks, stocks without positive earnings, growth stocks and stocks that pay no dividend), because their prices tend to be most overvalued when sentiment is high.
- In contrast, larger-capitalization stocks with substantial tangible assets, high liquidity and low idiosyncratic volatility are less susceptible to sentiment-related mispricing.
- A separate test using the University of Michigan’s Consumer Sentiment Index as a proxy for investor sentiment yields similar results.
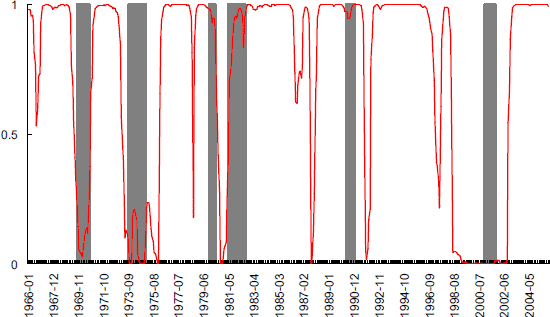
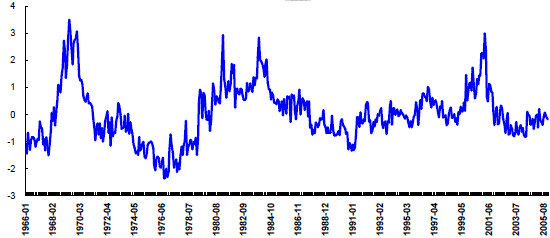
The following two charts, taken from the paper, plot the market regime indicator and the sentiment index over the entire sample period. The market regime indicator (red line in upper chart) derives from stock market returns, with a high (low) value representing a bull (bear) regime. Intervals shaded in gray denote recessions as designated by the National Bureau of Economic Research. The multi-indicator sentiment index (blue line in lower chart) is a composite of six sentiment indicators.


In summary, evidence indicates that a high level of investor sentiment during a bull market may be a useful predictor of low future returns for speculative stocks. Sentiment has little or no power to predict returns during bear markets or for non-speculative stocks.