Do stocks trading on Over-the-Counter (OTC) markets, generally off limits for institutional traders, present in aggregate a good opportunity for individual investors? In their December 2010 paper entitled “Do Investors Overpay for Stocks with Lottery-Like Payoffs? An Examination of the Returns on OTC Stocks”, Bjørn Eraker and Mark Ready examine returns on U.S. OTC Bulletin Board and Pink Sheet stocks. Using stock price and firm data for 11,260 OTC companies (about a third of which were once listed) over the period 2000 through 2008, they find that:
- Over the sample period, dollar volume of trading in U.S. OTC markets was about $820 billion, with a net loss in capitalization of $180 billion. An investor following a market capitalization-weighted buy-and-hold strategy would have lost 42% over this nine years.
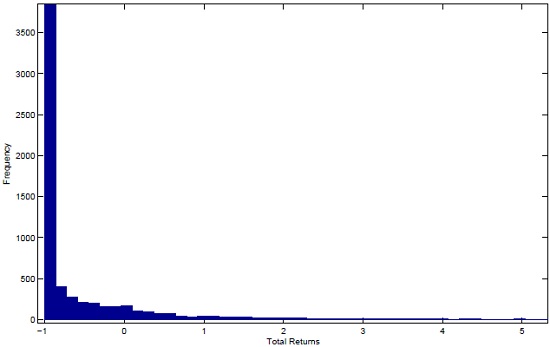
- The average total return per stock (from the first to last price observation) is about -40%. The median total return is -97%. While 130 stocks have more than a ten-fold increase in value, this 1.8% of the sample is much too small to make up for all the stocks that become nearly worthless. (See the histogram below.)
- Adjusted for the three Fama-French factors (market, size, book-to-market), the average alpha of OTC stocks is significantly negative. Nor does the bursting of the technology bubble in 2000 substantially explain the poor aggregate performance of OTC stocks.
- There is little difference between the average performances of delisted and never-listed stocks.
- Among individual OTC stocks, future returns relate:
- Positively to initial price, meaning that the cheapest stocks tend to have the lowest future returns.
- Negatively to prior-month return, possibly indicating mean reversion or pump-and-dump manipulation.
- Negatively to dollar trading volume, possibly indicating a substantial amount of fraudulent pumping.
- Results imply that OTC investors severely misjudge the underlying probability of success.
The following chart, taken from the paper, is a histogram of total cumulative returns for U.S. OTC stocks over the 2000-2008 sample period. The return distribution has a mean of about -40%, a median of -97% and a mode very close to -100%. Over the sample period, 52% of the stocks lose more than 95% of their value, and 83% have negative total returns. A very small percentage of OTC stocks have extremely positive returns (only 130 stocks increase in value by ten times or more).

In summary, evidence indicates that disaster (success) stories are common (rare) among OTC stocks.
For an example of putative OTC pump-and-dump pattern exploitation, see “Timothy Sykes: Penny Stock Pump-and-Dump Detective?”.