A reader requested a review of the trading methodology presented at TimothySykes.com (“Short Selling Penny Stocks”), which essentially uses price-volume analyses in attempts to detect in real time penny stocks being pumped and ride the ensuing downside (dump). Timothy Sykes, author of the An American Hedge Fund, is a former hedge fund manager and founder of BullShip Press LLC. His bio states: “Since the beginning of 2008, Timothy has been the #1 trader/investor, out of 25,000+ on Covestor.com.” Using the record of 296 trades spanning 2/1/08 through 1/22/10 (including those previously posted for October 2009, but now missing) and some recent clarifications from Timothy Sykes, we find that:
In emails on 1/22/10 and 1/23/10, Timothy Sykes provided the following clarifications on his public trading record:
- The date listed for each trade is the exit date. Most trades are one to three days in duration.
- Returns are net of transaction fees.
- About three quarters of the trades are shorts (attempting to ride the dump side of pump-and-dump scenarios down), and one quarter are longs (attempting to ride the pump side up). “Most of the time I just short a pumped up stock when it turns from green to red on the 3rd or 4th up-day when volume is fading.”
- He tries to alert subscribers to trades at the same time he executes them.
- He presently has about 1,500 subscribers.
For this review, we exclude one trade on 10/7/9 with a reported percentage gain of 800%. This trade, although very small dollar-wise, dominates trade-weighted statistics. Notable characteristics of the balance of 295 trades are:
- 74% of the trades are profitable.
- On a trade-weighted basis, the average net return per trade is 6.1%.
- The standard deviation of trade returns is 13%.
- On a dollar-weighted basis (derived from the trade data provided), the average net return per trade is about 4.0%. In other words, large trades tend to be less profitable than small trades.
- The arithmetic (geometric) mean monthly net return of the underlying portfolio is 10.5% (10.3%).
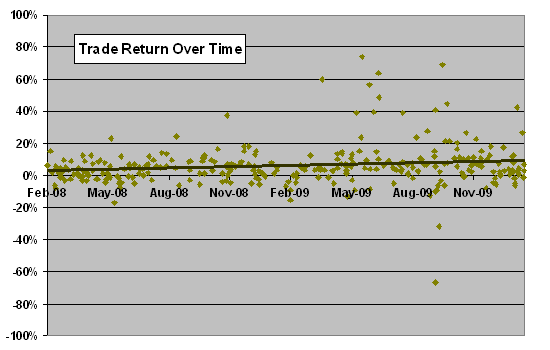
The following chart, a test of return persistence, shows the trend in net return by trade over time. Results indicate persistence over the sample period in average net return per trade, though perhaps some growth in return volatility. The average net return for February 2008 through January 2009 (February 2009 through January 2010) is 3.8% (8.2%).

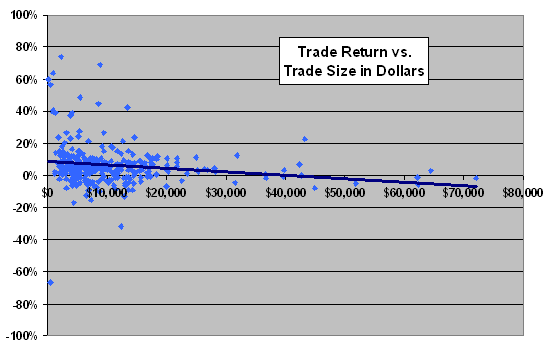
As noted above, there appears to be a scaling constraint within the set of trades. The following scatter plot relates trade return to trade size in dollars for the 295 trades evaluated, indicating a tendency for large trades to be less profitable than small trades.
Subscribers seeking to tag along on these trades therefore may face a scaling constraint that grows with the number of subscribers participating. It is not obvious that those tagging along would be reliably profitable in aggregate. For example, 1,500 subscribers tagging along on an alert at $10,000 per subscriber would create a $15 million aggregate “trade.” The impact of such trading on penny stock prices could well be material, expanding bid-ask spreads and moving prices against profitability.
Another way to think about this scaling constraint is that, based on the monthly geometric mean return of 10.3%, 1,500 subscribers with accounts of $100,000 each would capture $500 billion from dumb traders over three years and $18.6 trillion over ten years. Could this much dumb money (from traders taking the wrong side of penny stock pump-and-dump scenarios) exist?
For additional perspective on this constraint (and another one), we examine rankings.

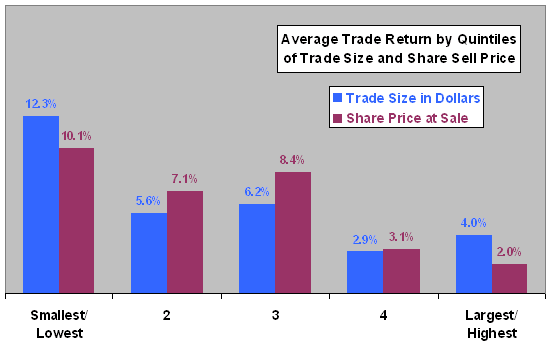
The final chart shows the average trade return by quintile of trade size in dollars and by quintile of share sale price for the 295 trades considered. Results indicate that profitability tends to concentrate in smaller trades and in trades involving the lowest-price stocks.

The above analyses assume that the trade data on TimothySykes.com is accurate and complete as presented. They do not incorporate open positrons (marked to market), which have not reached targeted exit prices and would therefore likely lower the average return. Based on the methodology, there are probably not many open positions at any given time.
Another type of scalability constraint on subscribers is a potentially severe limitation on availability of shares to borrow for shorting. For example, in a 1/23/10 email, Timothy Sykes reported that: “…the vast majority of shares are taken or not available to short true pump-and-dumps so the opening of my pre-market watch list is key to succeeding with my bread and butter strategy of shorting blatant pumps…see my short of MDCE recently where only a few dozen of my subscribers found shares to short since they didn’t reserve them early like I did…gift and curse of my strategy aka this limited scalability…” In other words, only the most attentive and nimble few percent of about 1,500 subscribers were able to tag along on the short trade. For this reason, Timothy Sykes advocates that subscribers learn to apply the methodology themselves, so that they can identify pump-and-dump opportunities for private exploitation rather than tagging along on his trades. In his own words: “I hate those ‘gurus’ who just want people to copy their picks.”
The extensive TimothySykes.com Terms of Service state, among other disclaimers:
- “It should not be assumed that the methods, techniques, or indicators presented in these products will be profitable or that they will not result in losses.”
- “…the indicators, strategies, columns, articles and all other features of Company’s products (collectively, the ‘Information’) are provided for informational and educational purposes only and should not be construed as investment advice.”
- “You should always check with your licensed financial advisor and tax advisor to determine the suitability of any investment.”
- “…under no circumstances, and in no event, shall BullShip Press, LLC be liable for direct, indirect, or incidental damages resulting from your use of that information, commentary, or entertainment.”
- “BullShip Press, LLC cannot and does not warrant the completeness, reliability, availability, usefulness, or content of the information, products or services, and warranties of title, non-infringement, merchantability or fitness for a particular purpose. Further, you agree that BullShip Press, LLC shall not be held liable to anyone for any loss or injury resulting from the direct or indirect use of BullShip Press, LLC’s Web site, Content or services.”
- “…BullShip Press, LLC shall not be liable for any decision made or action taken by you or others based upon reliance on news, information, or any material published by BullShip Press, LLC.”
- “…BullShip Press, LLC makes no claims or representations with regard to the accuracy, completeness, or truth of any material contained herein.”
In summary, evidence from simple tests on available data supports a belief that Timothy Sykes can identify pump-and-dump patterns in real time with economically meaningful consistency, but scalability is constrained such that his subscribers may not be able to mimic his trades reliably. Niche constraints may preclude exploitation by large traders, a large group of small traders and funds.