Do smart beta indexes efficiently exploit factor premiums? In his April 2016 paper entitled “Factor Investing with Smart Beta Indices”, David Blitz investigates how well smart beta indexes, which deviate from the capitalization-weighted market per mechanical rules, capture corresponding factor portfolios. He consider five factors: value, momentum, low-volatility, profitability and investment. He measures their practically exploitable premiums via returns on long-only value-weighted or equal-weighted portfolios of the 30% of large-capitalization U.S. stocks with the most attractive factor values. He tests six smart beta indexes:
- Russell 1000 Value.
- MSCI Value Weighted.
- MSCI Momentum.
- S&P Low Volatility.
- MSCI Quality.
- MSCI High Dividend.
Using monthly data for the five factor portfolios and the six smart beta indexes as available through December 2015, he finds that:
- For the factor portfolios:
- An equally weighted combination of value-weighted value, momentum and low-volatility factor portfolios has gross annualized Sharpe ratio 0.49, compared to 0.32 for the capitalization-weighted market portfolio.
- Using equal-weighted rather than value-weighted factor portfolios boosts this Sharpe ratio to 0.58
- Adding profitability and investment factor portfolios to the combination does not improve these Sharpe ratios, but does improve performance relative to the market.
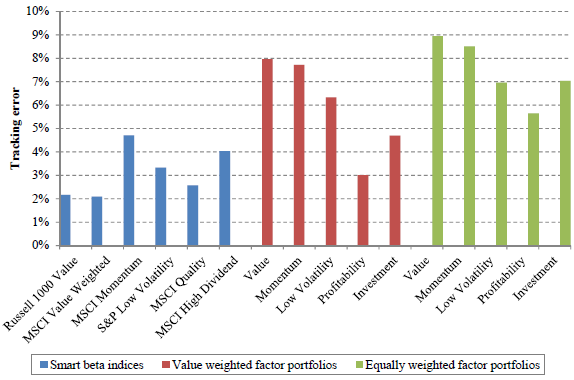
- In general, the smart beta indexes track the capitalization-weighted market more closely than do the factor portfolios (see the chart below). Specifically, annualized tracking errors during 2001 through 2015 range from:
- About 2% for value indexes to about 5% for MSCI Momentum across the six smart beta indexes.
- 3% to 8% across the five value-weighted factor portfolios.
- 5% to 9% across the five equal-weighted factor portfolios.
- Value-weighted factor exposures and factor focuses for the smart beta indexes vary considerably.
- Russell 1000 Value has the largest value factor exposure (still only 36%) and some exposures to the investment (21%) and low-volatility (20%) factors.
- MSCI Value Weighted has only 29% exposure to the value factor.
- MSCI Momentum loads heavily on the momentum factor (73%).
- S&P Low Volatility loads heavily on the low-volatility factor (71%).
- MSCI Quality loads heavily on the profitability factor (76%).
- MSCI High Dividend loads very heavily on the low-volatility factor (83%), with some exposure to the value factor. In other words, MSCI High Dividend is largely redundant with S&P Low Volatility.
- Only S&P Low Volatility loads heavily on an equal-weighted factor portfolio in preference to a value-weighted factor portfolio. In other words, most smart beta indexes do not capture higher equal-weighted factor premiums.
The following chart, taken from the paper, summarizes annualized tracking errors relative to the capitalization-weighted market for the six smart beta indexes, the five value-weighted factor portfolios and the five equal-weighted factor portfolios as described above during January 2001 through December 2015. The smart beta indexes are generally much more like the broad market than are the factor portfolios.
In summary, evidence suggests that smart beta indexes capture only parts of corresponding factor premiums, and ostensibly similar smart beta indexes may have different capture efficiencies.
Cautions regarding findings include:
- In general, returns associated with smart beta indexes and factor portfolios are gross, not net. Trading frictions associated with maintaining the stock weights they specify in real portfolios may differ substantially, such that net findings would differ from gross findings.
- Testing many indexes/factor portfolios on the same set of data introduces snooping bias, such that the best performances overstate expectations.