How good can factor investing get? In his May 2016 paper entitled “Quantitative Style Investing”, Mike Dickson examines strategies that:
- Aggregate return forecasting power of four or six theoretically-motivated stock factors (or characteristics) via monthly multivariate regressions.
- Use inception-to-date simple averages of regression coefficients, starting after the first 60 months and updating annually, to suppress estimation and sampling error.
- Create equally weighted portfolios that are long (short) the 50%, 20%, 10%, 4%, 2% or 1% of stocks with the highest (lowest) expected returns.
The six stock characteristics are: (1) market capitalization; (2), book-to-market ratio; (3) gross profit-to-asset ratio; (4) investment (annual total asset growth); (5) last-month return; and, (6) momentum (return from 12 months ago to two months ago). He considers strategies employing all six characteristics (Model 1) or just the first four, slow-moving ones (Model 2). He considers samples with or without microcaps (capitalizations less than the 20% percentile for NYSE stocks). He estimates trading frictions as 1% of the value traded each month in rebalancing to equal weight. Using monthly data for a broad sample of U.S. common stocks during July 1963 through December 2013 (with evaluated returns commencing July 1968), he finds that:
- For both models and both stock universes, average monthly gross long-short return spreads increase systematically as exclusivity increases from top-bottom 50% to top-bottom 1%.
- Monthly gross Sharpe ratios are:
- Largest in most cases for the top-bottom 2%.
- Mostly larger for top-bottom 4% than for top-bottom 1%.
- Consistently larger for top-bottom 2% and 4% than for top-bottom 10%.
- For net performance in the full sample:
- An equally weighted portfolio of all stocks generates annualized return 13.6% and Sharpe ratio 0.42, with annual turnover 67% and maximum drawdown (MaxDD) is -45%.
- The Model 1 top-bottom 2% (4%) generate annualized return 47.8% (41.8%) and Sharpe ratio 1.97 (1.90), with annual turnover 534% (508%) and MaxDD -47% (-41%).
- The Model 2 top-bottom 2% (4%) generate annualized return 28.5% (23.8%) and Sharpe ratio 1.03 (0.94), with annual turnover 130% (119%) and MaxDD -37% (-33%).
- The Model 2 top-bottom 50% generate annualized return 12.4% and Sharpe ratio 0.99, with annual turnover 67% and MaxDD -17%.
- The Model 2 top 4% (long-only) generate net annualized return 25.0% and Sharpe ratio 0.75, with annual turnover 120% and MaxDD -46%..
- For net performance in the sample excluding microcaps:
- The Model 2 top-bottom 2% (4%) generate annualized return 25.0% (21.4%) and Sharpe ratio 0.95 (0.89), with annual turnover 524% (502%) and MaxDD -41% (-38%).
- The Model 2 top 4% (long-only) generate annualized return 17.4% and Sharpe ratio 0.51, with annual turnover 88% and MaxDD -49%.
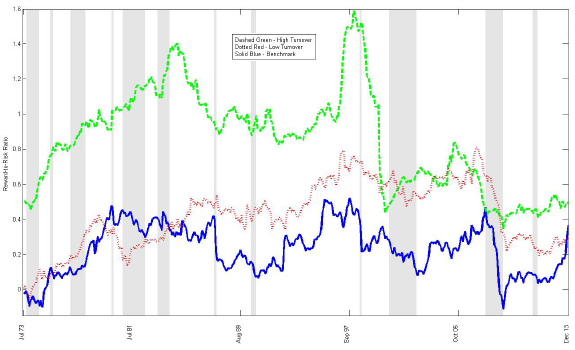
- While the reward-to-risk ratio is generally larger for the best-performing strategies (Model 1 and Model 2, top-bottom 2%) than for the benchmark, the gap appears to shrink in recent years (see the chart below).
The following chart, taken from the paper, compares rolling 60-month net reward-to-risk ratios during July 1973 through December 2013 for three strategies:
- Green line: the best-performing strategy based on all six stock characteristics (Model 1, top-bottom 2%) applied to the full sample.
- Red dotted line: the best-performing strategy excluding past return characteristics (Model 2, top-bottom 2%) applied to the full sample.
- Blue line: the benchmark (equally weighted full sample).
All portfolios are rebalanced monthly to equal weight. While the active strategies generally outperform the benchmark: outperformance of the aggressive Model 1 is markedly lower since 1999; outperformance of Model 2 recently disappears.
In summary, evidence indicates that multi-factor stock selection strategies may be attractive.
Cautions regarding findings include:
- The strategies tested have many moving parts, creating potential for considerable data snooping, including: selection of stock characteristics (variables that may have been snooped in prior research), stock universe (with or without microcaps), regression coefficient smoothing lookback interval and update frequency, and portfolio size (percentile extremity). The best-performing strategies therefore may be materially lucky.
- Analyses assume that shorting is always possible (there are shares to borrow) as specified in hedge portfolios at zero net cost. Borrowing of shares may be costly or impossible, perhaps especially for the most extreme percentile portfolios.
- Since the best-performing strategies have high turnovers, simplifying assumptions about trading frictions may may be problematic. Specifically:
- Trading frictions differ across categories of stocks. For example, frictions are likely much higher for microcaps than for other stocks.
- Trading frictions vary considerably over the sample period and are likely too low early in the sample period and too high late in the sample period (see “Trading Frictions over the Long Run”). Subperiod robustness testing might clarify.
- Strategy data collection/processing burdens are beyond the reach of most investors, who would bear fees for delegating these efforts to an investment manager.