How stable is the mean-variance efficient frontier specified by Modern Portfolio Theory (MPT), and what drives changes to it? In his March 2013 paper entitled “Principal Component Analysis of Time Variations in the Mean-Variance Efficient Frontier”, Andreas Steiner applies principal component analysis to explore sources of the variability in the efficient frontier. He uses weekly data and rolling 52-week intervals to calculate the efficient frontier (via asset returns, volatilities and correlations) for a long-only, unleveraged portfolio of 22 Swiss stocks. He next discovers purely statistical independent linear factors needed to describe efficient frontier variability (using ten sample points along each efficient frontier curve). He then measures the relative importance of the factors and relates them to common investment performance statistics (average returns, volatilities and correlations). Using weekly returns for the specified stocks during late June 2002 through December 2012 (549 weeks), he finds that:
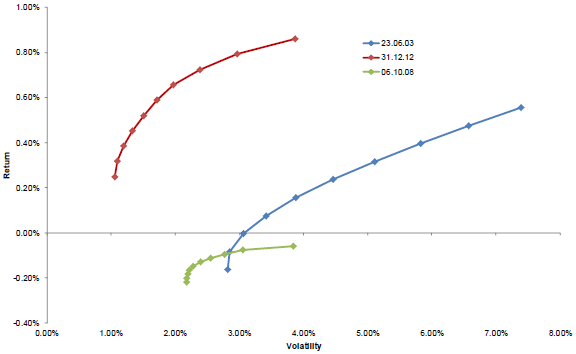
- The efficient frontier of the specified portfolio varies considerably over the sample period (see the chart below).
- The first independent linear factor explains most (94.5%) of efficient frontier variability. Adding the second factor boosts explanatory power to 98.2%. Adding the third factor boosts explanatory power to 99.3%.
- The three factors relate to efficient frontier level, slope and curvature, similarly to factors derived from analysis of yield curve dynamics.
- The dominant first linear factor correlates strongly with average return of stocks in the portfolio during the measurement interval. In other words, changes in the efficient frontier are mostly due to variation in asset returns. The second and third linear factors do not relate either to average volatility or average pairwise correlation of the stocks in the portfolio. In other words, variations in portfolio returns move the efficient frontier, but variations in portfolio volatility and correlation have little effect.
The following chart, taken from the paper, illustrates the range of variability observed in the mean-variance efficient frontier for the specified portfolio of 22 stocks. The June 2003 and December 2012 frontiers mark the beginning (using the first 52 weeks for calculations) and end of the sample period, while the October 2008 frontier represents an extreme market environment.
In summary, evidence suggests that asset returns dominate specification of the mean-variance efficient frontier, with considerable resulting variation (and therefore difficulty in optimizing for the future).
Cautions regarding findings include:
- As noted in the paper, the analysis addresses a restricted version (long-only, unleveraged) application of MPT.
- As noted in the paper, efficient frontier curve calculations are in-sample, based on same-interval returns and not prior forecasts of returns.
- The paper does not address implications of variation in the efficient frontier for changes in portfolio allocations. It seems plausible that large movements in the frontier would drive substantial reallocations.
For a different perspective, see “Asset Class Diversification Effectiveness Factors”.