“The Industry 52-week High Effect” summarizes findings that the 52-week high effect, the future outperformance (underperformance) of stocks currently near their respective 52-week highs (lows), is stronger and more consistent for 20 industries than for individual stocks. Do findings apply to equity sectors that are somewhat broader than the 20 industries? Specifically, might such a strategy outperform past six-month return when applied to the following nine sector exchange-traded funds (ETF) defined by the Select Sector Standard & Poor’s Depository Receipts (SPDR), all of which have trading data back to December 1998:
Materials Select Sector SPDR (XLB)
Energy Select Sector SPDR (XLE)
Financial Select Sector SPDR (XLF)
Industrial Select Sector SPDR (XLI)
Technology Select Sector SPDR (XLK)
Consumer Staples Select Sector SPDR (XLP)
Utilities Select Sector SPDR (XLU)
Health Care Select Sector SPDR (XLV)
Consumer Discretionary Select SPDR (XLY)
To check, we consider three strategies based on closeness of each sector ETF to its 12-month high, defined as ratio of monthly close to highest monthly close over the prior 12 months. The three strategies are to: (1) allocate all funds each month to the sector ETF closest to its 12-month high at the end of the preceding month (12MH-1); (2) allocate all funds each month to the sector ETF closest to its 12-month high at the end of the month before the preceding month (12MH-1;1); and, (3) allocate all funds each quarter to the sector ETF closest to its 12-month high at the end of the month before the end of the quarter (12MH-3;1). Strategy (2) addresses the concern that a sector ETF surging toward a 12-month might experience some reversion the next month, and strategy (3) addresses the concern (based on the methodology in “The Industry 52-week High Effect”) that the effect materializes over several months. For comparison, we include the strategy of monthly allocation to the sector ETF with the highest total return over the past six months (6-1). Using monthly dividend-adjusted closing prices for the nine sector ETFs and S&P Depository Receipts (SPY) over the period December 1998 through March 2011 (148 months), we find that:
Note that the three test strategies require use of the first 12 months of the sample for calculating closeness to 12-month highs and month 13 as a skip-month, so return calculations start in month 14 of the sample.
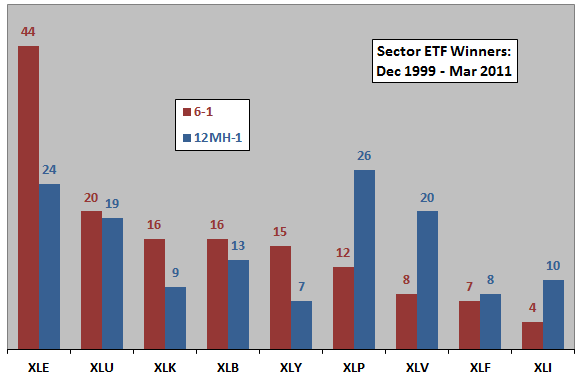
The following chart compares the distributions of 136 sector ETF winners for the benchmark 6-1 momentum strategy and the 12MH-1 strategy over the available sample period. The distributions are quite different, with the 12MH-1 strategy switching more frequently (87 versus 56 times).
How do the 12-month high strategies translate into cumulative returns?

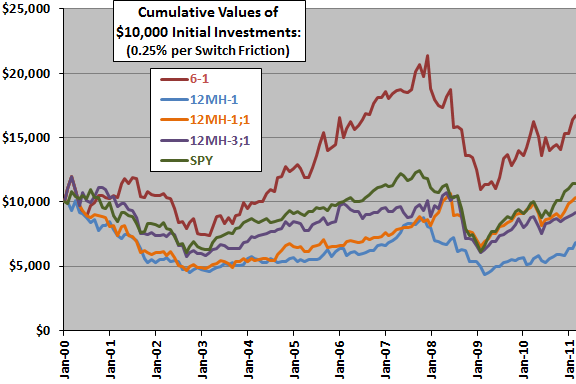
The next chart compares the cumulative values of $10,000 initial investments in the three 12-month high strategies, the benchmark 6-1 strategy and SPY over the available sample period. Calculations derive from the following assumptions:
- Reallocate at the close on the last trading days of signaled months/quarters (assume signals can be calculated just before the close).
- Trading (switching) friction is 0.25% of the balance whenever there is a change in ETF.
- Ignore any tax implications of trading.
At the assumed level of switching friction, all three 12-month high strategy variations underperform the benchmark 6-1 strategy and buying and holding SPY. Setting trading friction to zero enables the 12MH-1;1 strategy to outperform SPY modestly part of the time, but the other two 12-month high strategies still generally underperform SPY.
Average net monthly returns for the 12MH-1, 12MH-1;1 and 12MH-3;1 strategies are-0.14%, 0.15% and 0.09%, respectively, compared to 0.56% for the benchmark 6-1 strategy and 0.21% for SPY. The 6-1 strategy (SPY) has a higher (lower) standard deviation of net monthly returns than do the 12-month high strategies.

In summary, the simple sector ETF 12-month high strategies have generally underperformed a simple sector ETF momentum strategy and the broad stock market over the past 12 years.
Reasons results do not agree with cited research may be that:
- Sample size is small (just 12 independent 12-month ranking intervals), and the poor performance of the 12-month high strategies may be anomalous.
- Nine sectors may not be sensitive enough to capture effects found for 20 industries in the cited research. However, it seems that the simplified approach should find some benefit.
- Measurement of highs relative to the previous 12 monthly closes (rather than the highest intraday value over the past 52 weeks) may not be sensitive enough to find the “high” effect. However, it seems that the simplified approach should find some benefit.