Are annual stock market winning and losing streaks informative about future market performance? To investigate, we consider up and down annual streaks for the Dow Jones Industrial Average (DJIA). We look at streaks in two ways:
- Retrospective (non-overlapping). We know the total duration of each streak.
- Experienced (real-time and partially overlapping). We know each year how long a streak has lasted, but we don’t know when it will end.
Using DJIA annual returns for 1929 through 2014 (86 years), we find that:
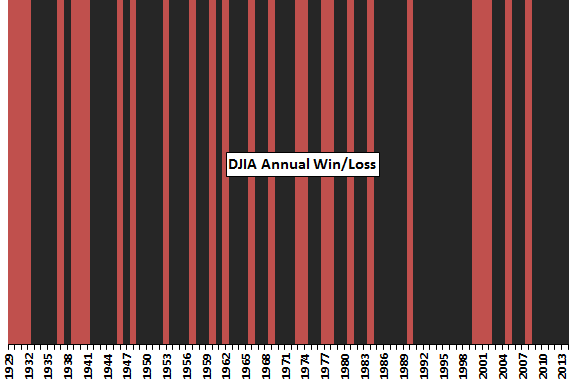
The following chart depicts winning (black) and losing (red) years for DJIA over the sample period. There is no obvious pattern in annual winning and losing streaks over time, but winning streaks appear to be longer on average than losing streaks.
What are the frequencies of different streaks?
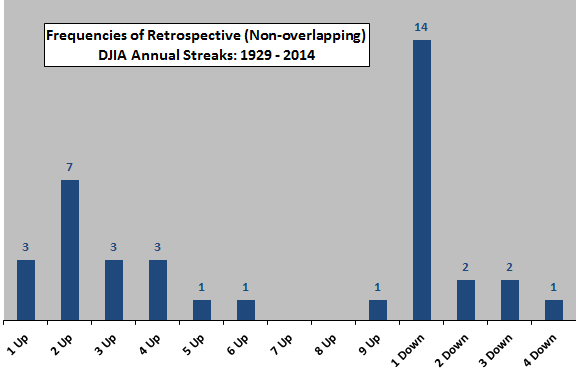
The next chart summarizes retrospective frequencies of different annual DJIA streaks over the sample period. “1 Down” is by far the most common annual streak, followed by “2 Up.” However, an investor operating in real time would not know when multi-year streaks will end. For example, an investor would experience the “3 Up” streaks as “2 Up” before observing the third years.
What distribution of frequencies would a real-time investor observe?
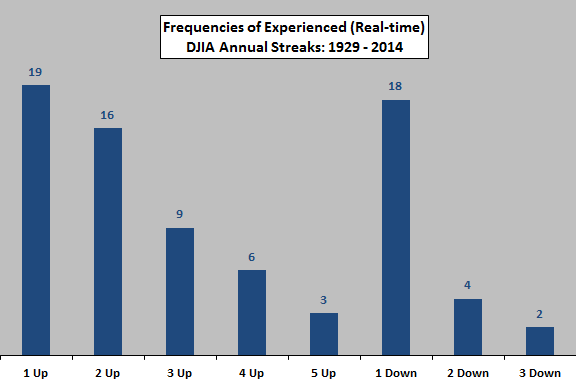
The next chart summarizes how an investor would count streaks as experienced in real time over the sample period (excluding those with only one observation). Frequencies of short streaks are higher than in the preceding chart because long streaks initially look like short streaks.
What are DJIA win rates after each kind of streak?
The next chart summarizes win rates (frequencies of annual gain) for DJIA after each kind of real-time streak over the sample period. In terms of sample sizes, the most meaningful win rates are those after “1 Up” and “1 Down” observations. The win rate after “3 Down” is 100% but based on only two observations, a sample too small for reliable inference.
How do the win rates translate into returns?

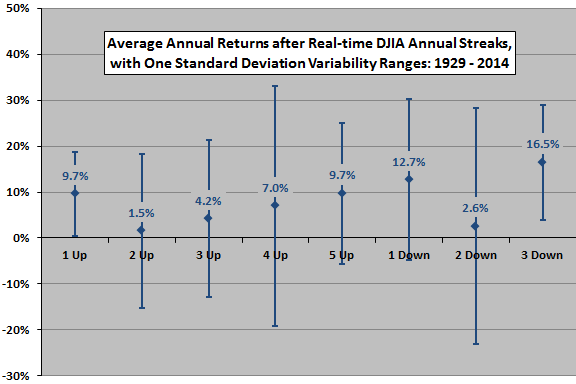
The next chart summarizes average annual returns with one standard deviation variability ranges for the years after different real-time DJIA streaks. For most kinds of streaks, samples are so small that results are very unreliable. Among the three kinds of streaks with at least 10 observations, “1 Up” and “1 Down” look relatively attractive, and “2 Up” looks unattractive.
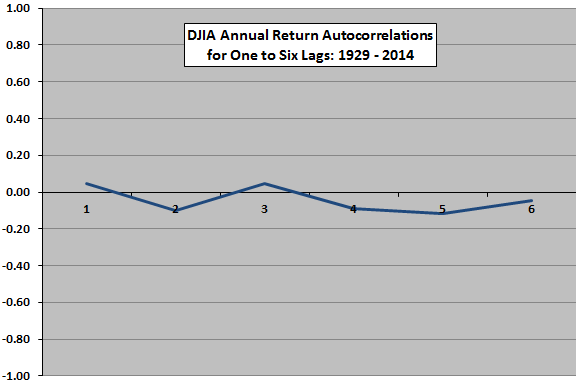
As a robustness test, we look at DJIA annual return autocorrelations.
The final chart shows DJIA annual return autocorrelations for lags of one to six years over the sample period. A positive (negative) autocorrelation suggest continuation (reversal) of returns at each of the specified lags. There are hints of return continuations and reversals at different lags. For example, the negative correlation for lag 2 hints at reversal of this year’s return two years hence. However, all correlations are small and could be just noise.
In summary, evidence from simple tests of DJIA annual returns offers little support for belief in reliable predictive power of annual streaks.
Cautions regarding findings include:
- As noted, streak subsamples range from small to extremely small, greatly limiting reliability of inferences.
- Other stock indexes and indexes for other asset classes may exhibit different streakiness.