Is a bad week or month in the stock market an indicator of further immediate deterioration? Using weekly and monthly S&P 500 index closing levels since 1950 (2,998 weeks and 689 months), we find that:
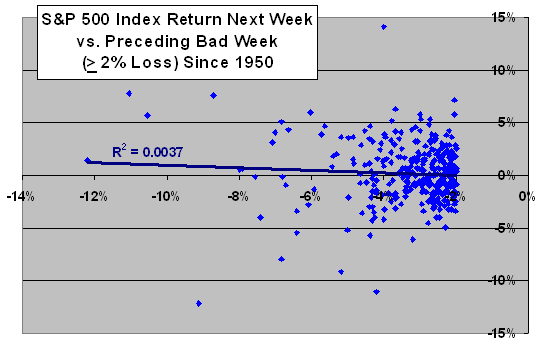
The following scatter plot relates change in the S&P 500 index next week to the change the preceding week when the latter is -2% or worse since 1950 (a total subsample of 309 bad weeks). The distribution appears to be widely scattered. The average S&P 500 index return is 0.22% after the 309 bad weeks and 0.17% after all weeks since 1950. The standard deviation of returns is 2.8% after bad weeks and 2.0% for all weeks. The single worst week is in October 1987.
A best fit line for the scatter runs slightly downhill, suggesting that the worse the preceding week, the better the next week. However, the Pearson correlation for this distribution is only -0.06, so any relationship is extremely weak. The R-squared statistic is just 0.0037, indicating that market return for the preceding week explains less than 0.5% of the return for the next week. Results do not support a conclusion that bad weeks reliably indicate either bad or good following weeks.
Might results be different for just the very worst weeks?

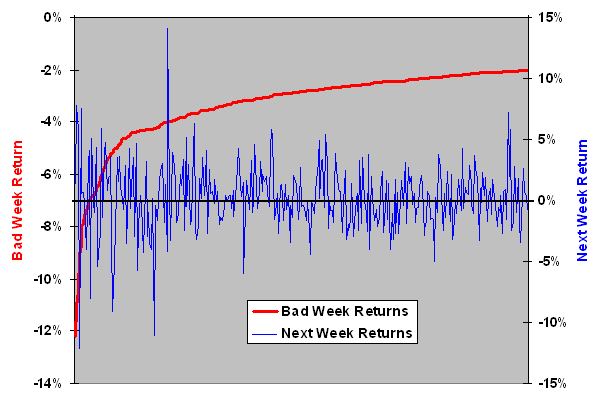
The next chart is a modified version of the prior scatter plot that orders the S&P 500 index returns for bad weeks from worst (-12.2%) to -2% to facilitate analysis of specific ranges. It shows that there are no ranges of bad-week returns (comprising a reasonable subsample size) that reliably predict next-week returns. It does suggest that the volatility of next-week returns is relatively high when returns for the preceding week are less than about -4% (72 instances). The average next-week return when preceding week returns are less than -4% is 0.19%, with standard deviation 4.3%.
Might results be more meaningful for back-to-back months?

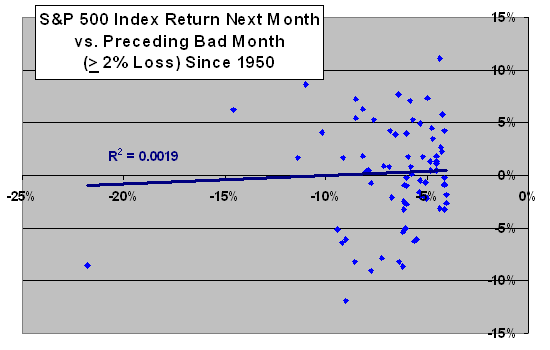
The next scatter plot relates change in the S&P 500 index next calendar month to the change the preceding calendar month when the latter is -4% or worse since 1950 (a total subsample of 76 bad months). This distribution also appears to be widely scattered. The average S&P 500 index return is 0.27% after the 76 bad months and 0.74% after all months since 1950, suggesting some tendency for below-average months to follow bad months. The standard deviation of returns is 5.1% after bad months and 4.1% for all months.
A best fit line for the scatter runs slightly uphill, suggesting that the worse the preceding month, the worse the next month. However, the Pearson correlation for this distribution is only 0.01, indicating no relationship. The R-squared statistic is just 0.0019, indicating that market return for the preceding month explains less than 0.2% of the return for the next month. The very worst month is October 1987 (-21.8%), the outlier in the lower left of the distribution. If we remove October 1987 from the subsample, the correlation changes from 0.01 to -0.11. Results do not support a conclusion that bad months reliably portend either bad or good following months.
Might results be different for just the very worst months?

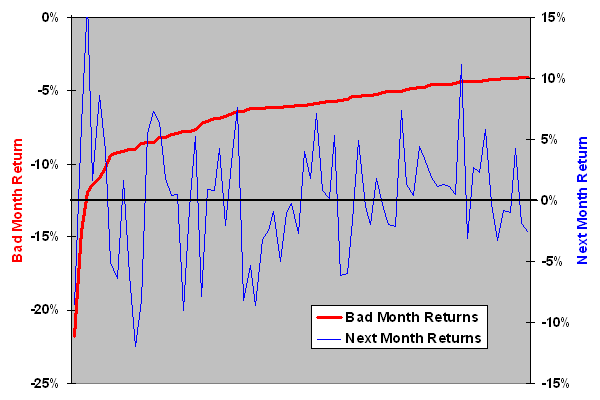
The final chart is a modified version of the prior scatter plot that orders the S&P 500 index returns for bad months from worst (-21.8%) to -4% to facilitate analysis of specific ranges. It shows that there are no ranges of bad-month returns of reasonable size that reliably predict next-month returns. It does suggest that the volatility of next-month returns is relatively high when returns for the preceding month are less than about -6% (39 instances).
The average next-month return when preceding month returns are less than -6% is -0.42%, with standard deviation 6.1%. Excluding the two worst next-month returns (September 1974 and November 1987) flips the average return to positive.

In summary, the stock market after a bad week (month) exhibits neither momentum nor reversal reliably the following week (month).