What is the best scheme over the long run for identifying U.S. stock market trends? In the May 2015 version of his paper entitled “Market Timing With a Robust Moving Average”, Valeriy Zakamulin isolates the most robust moving average weighting scheme for a U.S. stock market index based on monthly data. He tests 300 weighting schemes. For all schemes, test portfolios are in stocks (a risk-free asset) when the last index price is above (below) the moving average. His principal performance metric is the Sharpe ratio. He defines robust as: (1) being insensitive to outliers; and, (2) generating consistent performance across all observed market environments. He specifies the range of observed market environments as 30 subperiods, each 10 years in length (with 5-year overlaps). He assumes that there is no optimal trend measurement look-back interval and therefore considers 15 intervals (4 to 18 months). He therefore generates 450 ranks by Sharpe ratio for each of the 300 weighting schemes and defines the most robust as the one with the highest median rank. Using monthly estimates of the Standard and Poor’s Composite Total Return Index and the risk-free rate during January 1860 through December 2014, he finds that:
- A convex (conventional) exponential moving average (EMA) with decay factor 0.87 is the most robust weighting scheme for the U.S. stock market measured monthly across look-back intervals and subperiods. The range of EMA decay factors from 0.85 to 0.91 (steps of 0.01) comprises seven of the 10 most robust weighting schemes.
- The simple moving average (SMA) is the fifth most robust weighting scheme out of 300.
- In general, in order to be robust, a moving average weighting scheme must underweight the oldest price changes.
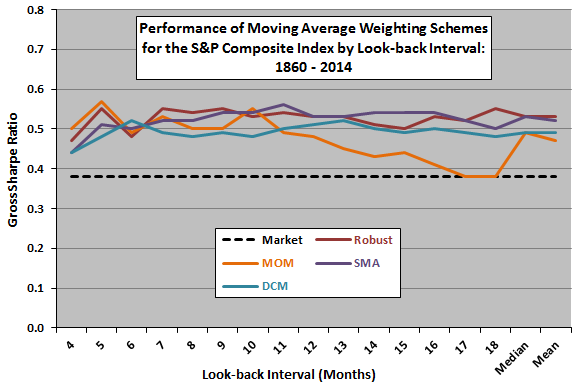
- Tested over the entire sample period, SMAs compare favorably with the most robust scheme across look-back intervals, while simple momentum rules perform well only for short look-back intervals (see the chart below).
- For a fixed look-back interval of 10 months, the robust weighting scheme has the highest (second highest) median (mean) rank across subperiods. SMA is competitive with the second highest (highest) median (mean) rank.
- Findings generally still hold when using:
- The Sortino ratio to measure weighting scheme performance.
- 5-year or 10-year non-overlapping subperiods, or 5-year subperiods with 2-year or 3-year overlaps.
- One-way stocks-cash trading frictions up to 0.5%.
The following chart, constructed from data in the paper, compares gross annualized Sharpe ratios of several moving average weighting schemes for different look-back intervals over the entire 1860-2014 sample period. Competing schemes are:
- Market – buy and hold the index.
- Robust – top-ranked scheme as detailed above (conventional EMA with decay factor 0.87).
- MOM – simple momentum based on prices at beginnings and ends of look-back intervals.
- SMA – simple moving average.
- DCM – double crossover method comparing short-interval and long-interval EMAs, both with decay factor 0.9.
Results suggest that:
- SMA is generally competitive with Robust.
- MOM is competitive for short look-back intervals, but not for long ones.
- DCM is generally inferior to Robust and SMA.
In summary, evidence suggests that a conventional EMA is the best moving average weighting scheme for the U.S. stock market over the long run, but the SMA is competitive.
Cautions regarding findings include:
- There may be data quality issues due to use of approximations/modeling in constructing the long price series.
- Testing many alternative rules on the same data introduces data snooping bias, such that the best-performing rules overstates expected Sharpe ratios. Since the number of rules tested is known, the study could explicitly correct for this bias.
- Data may not have been available in a timely manner as assumed over much of the sample period, making a part of backtests unrealistic. A robustness test with a delay between monthly moving average calculations and portfolio formation may be informative.
- Findings may differ for other asset price series due to inherently different behaviors (see, for example, “Optimal Intrinsic Momentum and SMA Intervals Across Asset Classes” and “SMA Signal Effectiveness Across Stock ETFs”).
- Use of an index ignores the costs of maintaining a tradable tracking fund. Incorporating such costs would lower all reported Sharpe ratios. Also, the existence of such a fund during the entire sample period may have altered investor behavior.
- Most analyses ignore stocks-cash switching frictions. Accounting for these frictions would lower Sharpe ratios for active strategies. Regarding the robustness test, the upper bound of 0.5% is arguably too low for large parts of the sample period (see “Trading Frictions Over the Long Run”).