Are Bollinger Bands (BB) useful for deciding when to buy low and when to sell high the overall U.S. stock market? In other words, can an investor beat a buy-and-hold strategy by systematically buying (selling) when the market crosses below (above) the lower (upper) BB? To check, we examine the historical behavior of BBs around the 21-trading day (one month) simple moving average (SMA) of S&P 500 SPDR (SPY) as a tradable proxy for the U.S. stock market, with 3-month Treasury bill (T-bill) yield as the return on cash when not in SPY. We consider BB settings ranging from 0.5 to 2.5 standard deviations of daily returns, calculated over the same trailing 21 trading days. We focus on net compound annual growth rate (CAGR), maximum drawdown (MaxDD) and annual Sharpe ratio (with average daily T-bill yield during a year as the risk-free rate for that year) as key performance metrics. Baseline SPY-cash switching frictions are 0.2%. Using daily unadjusted closes of of SPY (to calculate BBs), dividend-adjusted closes of SPY (to calculate total returns) and contemporaneous T-bill yield from the end of January 1993 (SPY inception) through late November 2019, we find that:
Test assumptions are:
- When daily unadjusted close of SPY crosses below (above) its lower (upper) BB, we buy (sell) at that close and hold the position until the next sell (buy) signal. This assumption requires slight anticipation of signals just before the close.
- Commence testing 4/2/93, when all BB variations are on buy signals.
- While out of SPY, funds earn the T-bill yield (ignoring settlement delays).
- For the baseline case, switching between SPY and cash bears 0.2% frictions (with a sensitivity test).
- Dividend reinvestment is frictionless.
- Ignore tax implications of trading.
First, we consider SPY behaviors when it is below, between and above BBs.
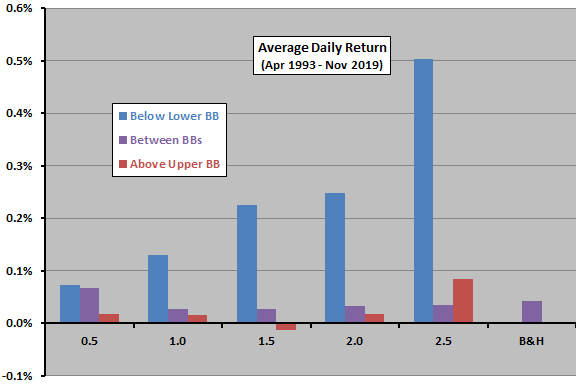
The following chart summarizes average next-day total returns when SPY is below the lower BB, between BBs or above the upper BB for BB settings ranging from 0.5 to 2.5 standard deviations below/above the 21-day SMA. It also shows average daily total return for buying and holding SPY (B&H). Notable points are:
- Increasing the BB setting increases average return below the lower BB (identifies stronger reversals).
- Between BBs, average return is mostly a little lower than for B&H.
- Average return is lower than for B&H above the higher BB, except for the highest setting (suggesting breakout rather than reversal for this setting).
What about daily return variabilities?
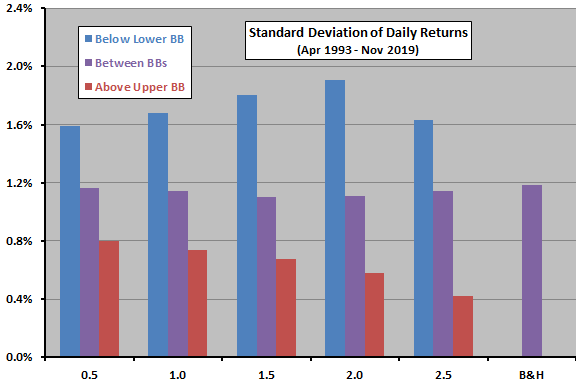
The next chart summarizes next-day return variabilities for the same BB settings. Notable points are:
- Returns below the lower BB are abnormally variable, with variability mostly increasing with BB setting.
- Returns between BBs have about the same variability as B&H.
- Returns above the upper BB are abnormally calm, more so as BB setting increases.
What about frequencies of occurrence?
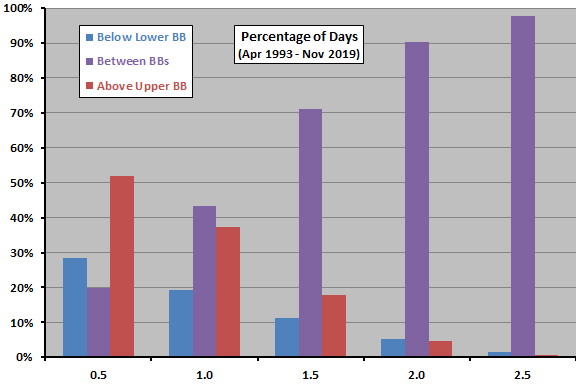
The next chart summarizes percentages of days spent below, between and above BBs for the same variations. Notable points are:
- For lower (higher) BB settings, observations above the upper BB are more (less) frequent than observations below the lower BB.
- For high settings, SPY-cash switches are rare.
How do these behaviors translate to trading strategies?
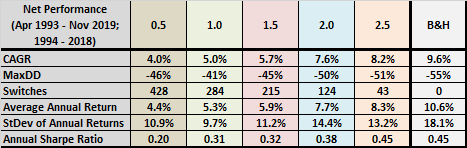
The following table summarizes net CAGRs, MaxDDs, number of SPY-cash switches, average annual returns, standard deviations of annual returns and annual Sharpe ratio for BB strategy variations as specified above. Notable points are:
- CAGR increases with BB setting, but never reaches that for B&H.
- MaxDDs are a little less severe than that for B&H, but still deep. There is no strict relationship between BB setting and MaxDD.
- Switches dramatically decrease with BB setting.
- Average annual return and Sharpe ratio increase with BB setting, but do not beat B&H.
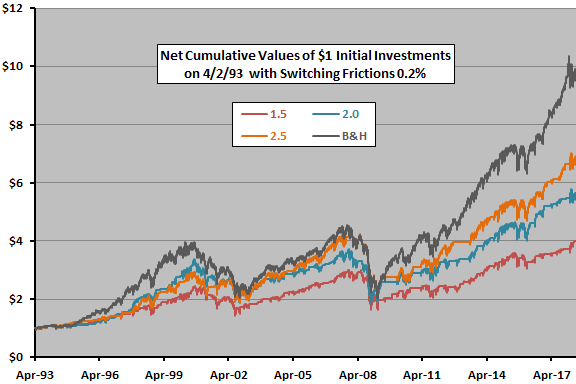
For another perspective we look at cumulative performance.
The next chart compares cumulative values of $1 initial investments in the BB strategy for the three highest settings from above, and for B&H, over the available sample period. The BB strategy mostly cannot keep up with B&H.
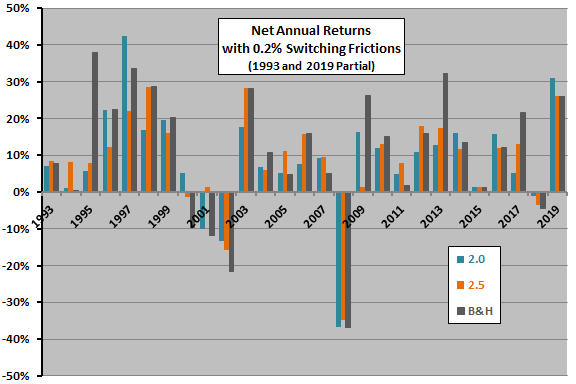
How do annual performances for the best BB strategy variations and B&H compare?
The next chart compares annual returns for the BB strategy variations with 2.0 and 2.5 standard deviation settings, and for B&H, by calendar year (1993 and 2019 partial). Both variations beat B&H during 13 of 27 years.
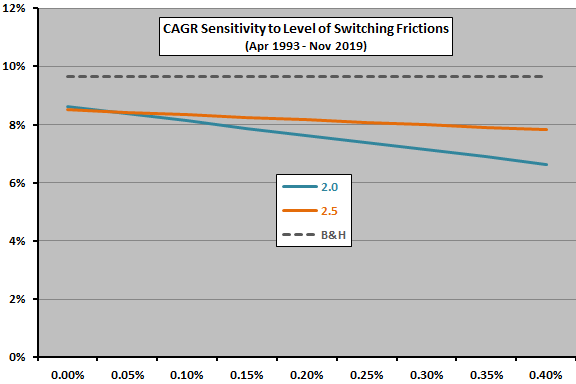
How sensitive are 2.0 and 2.5 BB strategy variations to assumed level of SPY-cash switching frictions?
The final chart shows how net CAGRs of 2.0 and 2.5 BB strategy variations change with assumed level of switching frictions (horizontal axis) over the sample period. Because 2.0 switches more frequently than 2.5 (124 versus 43 times), 2.0 deteriorates faster as switching frictions increase.
In summary, evidence from tests on SPY over nearly 26 years offers little support for belief that investors can beat the broad U.S. stock market by simply using Bollinger Bands to buy the market low and sell it high.
Cautions regarding findings include:
- The number of BB switching signals generated by the 2.5 standard deviation setting is modest, undermining confidence in statistics for that variation.
- Using a different BB measurement interval, using BB signals in some other way or combining them with some other indicator(s) may work better. However, the more combinations of rules/parameter settings considered, the greater the data snooping bias (luck component) in the best results.
- Switching to an asset other than cash may improve BB strategy performance. However, other assets bear risk of capital loss.
- Applying the same BB specification and settings to other assets may produce different results.
For other perspectives, see results of this search.