Is market breadth a reliable indicator of future stock market returns? To investigate, we perform simple tests on four daily U.S. stock market breadth metrics:
- RSP-SPY – Total return for Guggenheim S&P 500 Equal Weight (RSP) minus total return for SPDR S&P 500 (SPY).
- NYSE A/D – Number of NYSE advancing stocks divided by number of NYSE declining stocks.
- NYSE Up/Down Volume – Volume for NYSE advancing stocks divided by volume of NYSE declining stocks.
- NYSE 52-Week Highs-Lows – Number of NYSE 52-week highs minus number of NYSE 52-week lows.
We use SPY as a proxy for the U.S. stock market. We use correlation tests that assume linear relationships between breadth metrics and future SPY returns and ranking tests that do not. Samples commence May 2003 (initial RSP availability) for the first three and late October 2005 for the fourth. Using daily dividend-adjusted levels of RSP and SPY and daily data for components of the other three breadth metrics from specified start dates through most of August 2017, we find that:
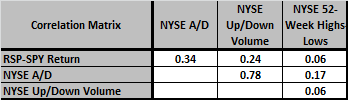
The following table is a pairwise correlation matrix relating the four breadth metrics. Only NYSE A/D and NYSE Up/Down Volume appear closely related. NYSE 52-Week Highs-Lows appears particularly unlike the others.
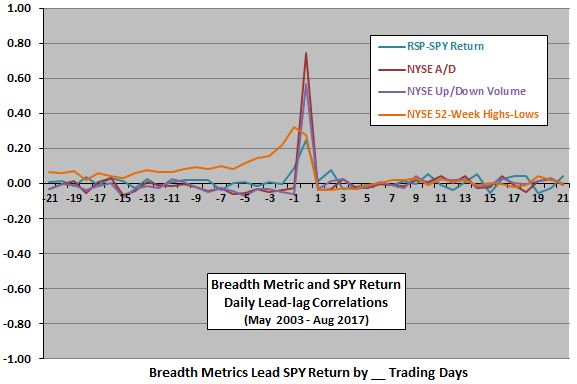
The following chart summarizes correlations of daily breadth metrics and daily SPY return for lead-lag relationships ranging from SPY return leads breadth metrics by 21 trading days (-21) to breadth metrics lead SPY return by 21 trading days (21) over full sample periods. Results suggest that:
- Except for NYSE 52-Week Highs-Lows, the strongest correlations are positive and coincident. In other words, breadth metrics tend to rise and fall with the market.
- There is little or no indication that breadth metrics lead SPY return at any horizon up to 21 trading days. All correlations for leads 1 to 21 days are small, and there are no long positive or negative correlation streaks.
- SPY return notably leads NYSE 52-Week Highs-Lows with positive correlations for leads -21 to -1. In other words, a persistently strong (weak) stock market produces more highs (lows) than lows (highs).
Forecasting near-term behavior of the stock market with the breadth metrics appears futile.
To suppress noise in daily data and look at longer-term predictive power, we look at average monthly values of breadth metrics.
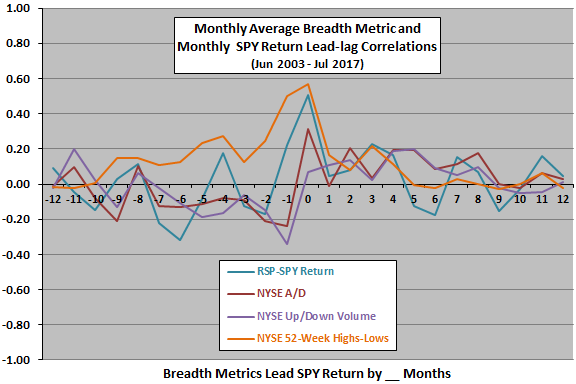
The next chart summarizes correlations of monthly average breadth metrics and monthly SPY return for lead-lag relationships ranging from SPY return leads breadth metrics by 12 months (-12) to breadth metrics lead SPY return by 12 months (12) over full sample periods. Results suggest that:
- Correlations are more positive than negative for breadth metric leads 1 to 12 months, suggesting that relatively high (low) breadth metrics predict relatively strong (weak) SPY returns. However, the correlations are modest and noisy.
- Except for NYSE 52-Week Highs-Lows, correlations are more negative than positive for SPY return leads -12 to -1 months, suggesting that a bullish (bearish) market predicts relatively low (high) breadth metrics. Again, correlations are modest and noisy.
- As for daily data, SPY return notably leads NYSE 52-Week Highs-Lows with positive correlations for leads -9 to -1. A bull (bear) stock market produces more highs (lows) than lows (highs).
The correlation analyses assume a linear relationship between breadth metrics and SPY returns. In case there are important non-linear effects, we look at average future SPY returns by ranked fifth (quintile) of monthly average breadth metrics.
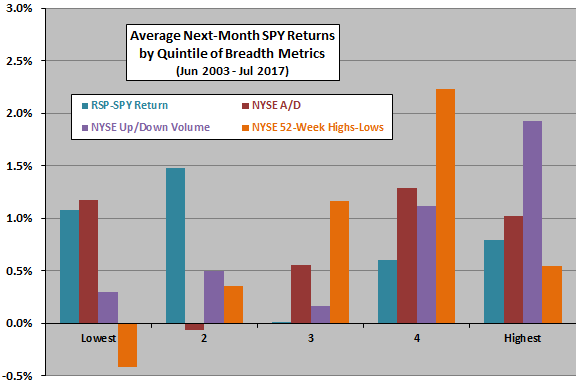
The next chart summarizes average next-month SPY returns by quintile of each monthly average breadth metric over full sample periods. The average return for all months in the sample is 0.8%. Results suggest that:
- None of the four breadth metrics varies systematically with next-month SPY return, though NYSE Up/Down Volume is close.
- RSP-SPY Return and NYSE A/D are probably not useful for predicting market return at a monthly horizon.
- NYSE Up/Down Volume and NYSE 52-Week Highs-Lows may be useful for predicting market return at a monthly horizon, though the latter breaks down at its highest values.
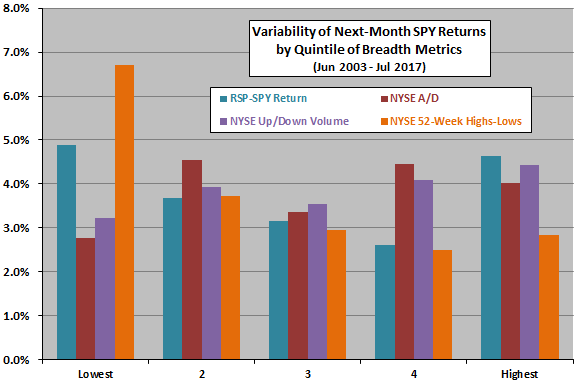
Next, we look at variability of SPY returns by breadth metric quintile.
The next chart summarizes variability (standard deviation) of next-month SPY returns by quintile of each monthly average breadth metric over full sample periods. The most notable result is that NYSE 52-Week Highs-Lows may be helpful for avoiding times when market returns are wild.
Finally, we assess reliability of findings via two robustness tests.
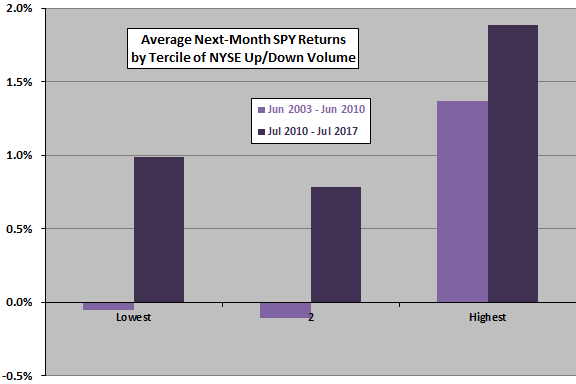
The next chart summarizes average next-month SPY returns by ranked third (tercile) of monthly average NYSE Up/Down Volume over two equal subperiods. Results suggest that:
- Relatively high volume ratios are better for future market returns than low ratios. However, middling ratios are a little worse than low ratios.
- Average market returns for middling and low ratios during the second subperiod are still attractive.
Is the 2008-2009 stock market crash critical to findings?
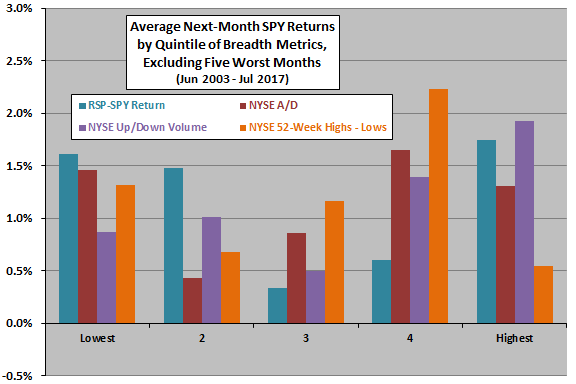
The final chart summarizes average next-month SPY returns by quintile of each monthly average breadth metric over full sample periods, excluding the five worst monthly SPY returns. These worst months all occur during the 2008-2009 stock market crash, as follows: June 2008, September 2008, October 2008, January 2009 and February 2009.
Excluding these crash months substantially reduces attractiveness of NYSE Up/Down Volume and NYSE 52-Week Highs-Lows as predictors of next-month SPY returns. In other words, prior results for these two metrics depend materially on presence of the 2008-2009 crash in the sample. They may not work as well for crashes with shapes different from that crash.
In summary, evidence regarding usefulness of various U.S. stock market breadth metrics is mixed. Of the four tested, NYSE Up/Down Volume appears most promising.
Cautions regarding findings include:
- As noted by the source for three of the breadth metrics, their reported values vary somewhat across original providers.
- As noted, the sample period for NYSE 52-Week Highs-Lows is shorter than those for the other breadth metrics.
- All analyses are in-sample. An investor trading during the sample periods could not exploit all the data (for example, in setting breadth metric thresholds). Since the breadth metrics seem suitable only for long-term investing (avoiding bear markets), the sample periods are short for in-sample and, especially, out-of-sample testing.
- Other breadth metrics may work better or worse. Testing multiple metrics on the same noisy market returns introduces data snooping bias, such that the best-performing metric overstates expectations.
- Using breadth metrics in combination with other technical indicators may improve results, but testing many combinations and multiple parameter settings for each indicator amplifies snooping bias.
See also: