Does candlestick technical analysis (examining relationships among opening, high, low and closing prices over the past 1-3 days to identify continuation and reversal signals) generate abnormal returns? In their recent paper entitled “Market Timing with Candlestick Technical Analysis”, Ben Marshall, Martin Young and Lawrence Rose test the profitability of trading stocks included in the Dow Jones Industrial Average based on 28 different candlestick signals. They assume a ten-day holding period after trading at the close on the day after a signal appears. Using stock price data for 1/1/92-12/31/02, they conclude that:
- Trading returns after bullish single-day signals are positive less than half the time. No bullish signals predict abnormal positive returns with high reliability (assuming a normal distribution of returns). In fact, one single-day bullish signal reliably predicts a negative return.
- The returns after bearish single-day signals are negative more than half the time. However, the mean returns for most bearish multi-day signals are positive, and two of these patterns indicate abnormal positive returns with high reliability (assuming a normal distribution of returns).
- Bootstrap tests (which more correctly do not assume a normal distribution of returns) show no evidence that any candlestick signals predict stock price movements.
- Results are robust to use of next-day opening rather than closing prices to initiate trades, and to sample subperiods.
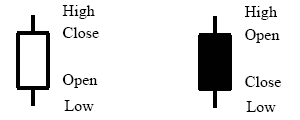
The following figure, taken from the paper, summarizes the basics of candlestick depiction. When stock price closes above (below) its opening level, the candle is white (black).

In summary, neither bullish nor bearish candlestick signals reliably generate abnormal returns in the expected direction for large-capitalization U.S. stocks during recent years.
Reader and author Greg Morris, a Senior Portfolio Manager, comments, as follows:
These types of studies are always short on components and generally miss some basic concepts. Candle patterns MUST first consider the trend (short term) of the market before they can be identified. Identifying a pattern or price movement and calling it a candle pattern without considering the trend is bogus at best.
[A] classic chart pattern (candles also) must include the investor/trader psychology/sentiment that evolves as the pattern evolves – that is what causes the pattern. Having a computer pick out price relationships solely, then saying if they are predictive or not is, well, that is what academia does so well.