Does an asset class breadth rule work better than a class-by-class exclusion rule for momentum strategy crash protection? In their July 2017 paper entitled “Breadth Momentum and Vigilant Asset Allocation (VAA): Winning More by Losing Less”, Wouter Keller and Jan Keuning introduce VAA as a dual momentum asset class strategy aiming at returns above 10% with drawdowns less than -20% deep. They specify momentum as the average of annualized total returns over the past 1, 3, 6 and 12 months. This specification gives greater weight to short lookback intervals than a simple average of past returns over these intervals. Specifically, they:
- Each month rank asset class proxies based on momentum.
- Each month select a “cash” holding as the one of short-term U.S. Treasury, intermediate-term U.S. Treasury and investment grade corporate bond funds with the highest momentum.
- Set (via backtest) a breadth protection threshold (B). When the number of asset class proxies with negative momentum (b) is equal to or greater than B, the allocation to “cash” is 100%. When b is less than B, the base allocation to “cash” is b/B.
- Set (via backtest) the number of top-performing asset class proxies to hold (T) in equal weights. When the base allocation to “cash” is less than 100% (so when b<B), allocate the balance to the top (1-b/B)T asset class proxies with highest momentum (irrespective of sign).
- Mitigate portfolio rebalancing intensity (when B and T are different) by rounding fractions b/B to multiples of 1/T.
They construct four test universes from: a short sample of 17 (mostly simulated) exchange traded fund (ETF)-like global asset class proxies spanning December 1969 through December 2016; and, a long sample of 21 index-like U.S. asset classes spanning December 1925 through December 2016. After reserving the first year for initial momentum calculations, they segment each sample into halves for in-sample optimization of B and T and out-of-sample testing. For all cases, they apply 0.1% one-way trading frictions for portfolio changes. Their key portfolio performance metrics are compound annual growth rate (CAGR), maximum drawdown (MaxDD) and a composite of the two. Using monthly returns for the selected ETF-like and index-like assets over respective sample periods, they find that:
- Across all four test universes:
- Out-of-sample CAGRs are above 10% and MaxDDs are less than -15% deep, generally beating an array of benchmarks.
- Average exposure to the “cash” asset is roughly 60%.
- Results suggest global diversification of asset class universes substantially enhances performance.
- For a moderately sized universe of 12 risky asset class proxies from the short global sample:
- Best in-sample performances concentrate around optimal B=4 and T=2, which has CAGR 21%, MaxDD -6% and annual Sharpe ratio 1.24.
- For B=4 and T=2 out-of-sample (see the left-hand table below), CAGR is 10%, MaxDD is -13% and annual Sharpe ratio is 0.51.
- For a small universe of just four risky asset class proxies (three equity and one bond) from the short global sample:
- Best in-sample performance is for B=1 and T=1, which has CAGR 22%, MaxDD -13% and annual Sharpe ratio 0.98.
- For B=1 and T=1 out-of-sample, CAGR is 16%, MaxDD is -10% and annual Sharpe ratio is 0.92.
- For a moderately sized universe of 15 risky asset class proxies (10 equity sectors plus five fixed income) from the long U.S. sample:
- Best in-sample performances concentrate around optimal B=3 and T=4, which has CAGR 11%, MaxDD -24% and annual Sharpe ratio 0.66.
- For B=3 and T=4 out-of-sample, CAGR is 12%, MaxDD is -12% and annual Sharpe ratio is 0.57.
- For a small universe of six risky asset class proxies (four U.S. size-value factors plus two fixed income) from the long sample:
- Best in-sample performances concentrate around optimal B=1 and T=6, which has CAGR 7.4%, MaxDD -25% and annual Sharpe ratio 0.42.
- For B=1 and T=6 out-of-sample, CAGR is 11%, MaxDD is -12% and annual Sharpe ratio is 0.48.
- Regarding robustness of findings for the two universes constructed from the short sample of global ETF-like asset class proxies:
- In-sample and out-of-sample optimal values of B are the same.
- VAA clearly beats equal weighting of all risky assets during subperiods of rising and falling interest rates.
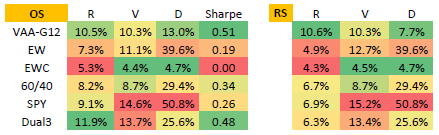
The following tables, extracted from the paper, compares to several benchmarks a few out-of-sample (OS) and recent sample (RS) performance statistics for VAA applied to the universe of 12 ETF-like global risky asset class proxies (VAA-G12). VAA-G12 risky assets are like SPY, IWM, QQQ, VGK, EWJ, VWO, VNQ, GSG, GLD, TLT, LQD and HYG. The “cash” universe consists of three ETF-like assets (SHY, IEF, LQD). Data prior to ETF inceptions are simulated. Performance statistics are CAGR (R), annualized volatility (V), MaxDD (D) and annual Sharpe ratio (Sharpe). The OS test period is December 1993 through December 2016 (23 years). The RS test period is December 2006 through December 2016 (10 years). Benchmarks are:
- EW– equally weighted, monthly rebalanced portfolio of the 12 VAA-G12 risky assets.
- EWC – equally weighted, monthly rebalanced portfolio of the three “cash” assets.
- 60/40 – 60% allocation to the SPY-like asset and 40% allocation to the IEF-like asset, rebalanced monthly.
- SPY– buy and hold the SPY-like asset.
- Dual3 – dual momentum (with momentum measured as specified above), each month holding equally weighted positions in the top three risky assets, but substituting “cash” for any of these three assets that have negative momentum.
Results indicate that VAA-G12 is an attractive approach to investment in risky assets out-of-sample overall and (especially) recently.
In summary, evidence indicates that asset class momentum with a conservative class breadth rule for crash protection, as specified in VAA, performs well with low risk out-of-sample.
Cautions regarding findings include:
- VAA involves many modeling/parameter choices, creating opportunities for introduction of snooping bias. Specifying B and T via in-sample optimization and out-of-sample testing narrowly defeats snooping bias for those choices, and the fact that optimal B is the same in-sample and out-of-sample for the two global asset universes is encouraging. However, VAA is evolutionary and thereby “aware” of findings from prior research involving much of the out-of-sample test period. In other words, VAA may inherit snooping bias via modeling decisions evolved from prior research. For additional discussion, see “Navigating the Data Snooping Icebergs”, “Taming the Factor Zoo?” and “Snooping Bias Accounting Tools”. Live testing on completely fresh data is a remedy.
- Simulating ETFs backward in time requires estimates of fund maintenance costs and fees, which likely would have varied over time. Errors in these estimates may affect findings.
- Use of indexes as proxies for tradable assets ignores the costs of maintaining liquid funds. These costs vary considerably over time and across asset classes, such that findings based on indexes may differ from those based on corresponding liquid assets.
- The existence of liquid asset class proxies (such as ETFs, enabled by improving data collection/processing technologies) may affect market behaviors (such as trending), such that pre-ETF markets behave differently from post-ETF markets.
- As noted in the paper, the assumed 0.1% one-way trading friction is too low for early parts of sample periods and probably too high for 2016. Findings may differ for realistic, changing trading frictions.
- The out-of-sample test period for global asset universes is not long for reliable inference, and the recent sample test period is short.