How do the returns from pairs trading (bets on the re-convergence of prices for similar stocks that have historically tracked but recently diverged) play out? Are there systematic ways to enhance pairs trading profitability? In the November 2008 version of their paper entitled “An Anatomy of Pairs Trading: the Role of Idiosyncratic News, Common Information and Liquidity”, Joseph Engelberg, Pengjie Gao and Ravi Jagannathan explore how news events and liquidity shocks relate to pairs trading profitability. Using daily prices for a broad set of stocks spanning January 1992 through June 2006 and related news items and trading data for January 1993 through December 2005, they conclude that:
The authors employ the following pairs trading process:
- On a monthly basis, match pairs by industry based on normalized price differences over the past year.
- Each month, extract the 200 most closely matching pairs to monitor for subsequent divergence.
- When a tracked pair diverges by more than two standard deviations of their normalized price difference, buy the “cheap” stock and sell the “expensive” one, after a one-day wait period (to mitigate the effects of any market irregularities).
- If prices for a traded pair re-converge, exit the paired positions.
- If prices for a traded pair do not re-converge within six months, close the positions. (An alternative strategy closes all traded pairs in ten trading days.)
Conclusions from the outcomes of this pairs trading process over the entire sample period are:
- Traded pairs tend to concentrate in a few industries: financial (44%), utilities (22%) and manufacturing (14%).
- The strategy with a maximum six-month holding period generates an average adjusted (market, size, book-to-market, momentum, short-term reversal) monthly return of 0.70% (before trading frictions). The average holding period is 66 trading days, and the average return per trade is 2.08% (before trading frictions).
- The strategy with a fixed holding period of ten trading days generates an average adjusted monthly return of 1.75% (before trading frictions), with an average return per trade of 0.83% (before trading frictions).
- Pairs trading profitability is lower when the initial divergence in prices relates to news specific to one stock in the pair. In other words, such a divergence tends to persist.
- Pairs trading profitability is higher when the initial divergence relates to news affecting both stocks in a pair, and there are reasons to believe that one stock reacts faster to news than the other (e.g., one is larger/more liquid than the other).
- Pairs trading profitability is lower when institutional investors hold both stocks and when sell-side analysts cover both stocks of the pair.
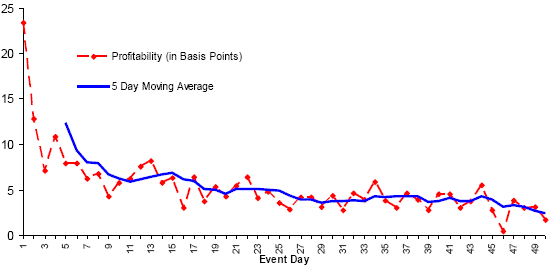
The following chart, taken from the paper, shows the evolution of daily profits for a typical pairs trade as described above over the period January 1993 through June 2006. It shows that profits on average decline quickly over time, from 0.23% the first trading day to 0.13% the second trading day to less than 0.10% per day after the fourth trading day.

In summary, the profitability of pairs trading relates strongly to differences between paired stocks regarding: (1) the speed with which news is likely to diffuse across the shareholder bases; and, (2) the frictions which probably inhibit acting on this news.