The typical long-term moving average used for technical analysis is 200 trading days. Do moving averages measured over even longer intervals have value? In the December 2010 version of their paper entitled “Technical Analysis with a Long Term Perspective: Trading Strategies and Market Timing Ability”, Dusan Isakov and Didier Marti investigate the performance of stock market trading rules based on simple moving averages (SMA) with measurement intervals up to four years. Their general assumption is that a short-term SMA crossing over (under) a long-term SMA predicts an up (down) trend, with a buffer useful for filtering noise when the values of the two SMAs are close. They consider a basic investment strategy of going long (short) the stock market at the next close after a filtered buy (sell) signal and otherwise staying in cash at the risk free rate. They test this strategy on a universe of 1,886 simple rules involving combinations of: 23 short-term SMAs with measurement intervals of one to 100 days; 48 long-term SMAs with measurement intervals of five to 1000 days; and, a buffer of 1% to filter noise. They then evaluate four complex rules for out-of-sample testing based on combining inception-to-date or rolling historical outputs of the 1,886 simple rules. They also investigate the effects of leverage implemented through debt or index options. Using daily closing levels of the S&P 500 Index to compute moving averages and daily returns and contemporaneous lending and borrowing rates and index option prices over the period 1990 through 2008 (with 1990 through 1993 reserved for initial estimation), they find that:
- Over the 1994-2008 test period, simple rules based on long-interval SMAs tend to outperform those based on short-interval SMAs at a gross level, with outperformance concentrated in 2005-2008.
- Gross returns for rules based on short-interval SMAs are at best equal to that for buy-and-hold and often negative.
- Rules based on long-interval SMAs generate average gross returns up to more than two times the buy-and-hold return.
- The best in-sample gross return among simple rules utilizes a SMA measurement interval of 465 days.
- Success of the complex rules relies on large values for long-term SMA measurement intervals.
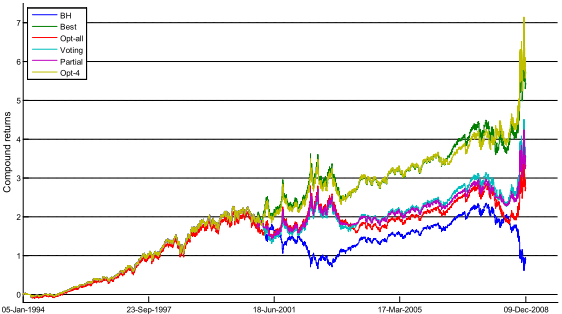
- The four complex rules generate average annual (cumulative) gross returns ranging from 9.2% to 13.6% (274% to 572%), compared to 6.1% (90%) for buy-and-hold, but statistical significance is doubtful. Trading frictions are likely immaterial since the four strategies generate only seven to 39 position changes over the 15-year test period.
- Leverage improves the risk-adjusted profitability of the complex rules when implemented with debt (but not with derivatives) by a factor of about two.
- The percentage of signals generated by the four complex rules that are “in phase” with the stock market state (bull or bear) ranges between 83% to 88% (over 90% for bull markets and between 61% and 74% for bear markets), compared to an overall 75% for buy-and-hold.
The following chart, taken from the paper, plots the cumulative returns over the entire 15-year test period for the four complex trading rules, buy-and-hold (BH) and the optimal in-sample simple SMA trading rule (Best). Outperformance of all rules relative to BH appears to depend crucially on the number and severity of bear markets in the sample. As noted above, these levels of outperformance are economically large, but not clearly statistically significant.

In summary, evidence from complex tests offers some support for a belief that trading rules based on simple moving averages with very long measurement intervals outperform both a buy-and-hold approach and rules based on simple moving averages with shorter measurement intervals.
Cautions regarding findings include:
- As indicated by the doubtful statistical significance, the sample period in terms of number of independent SMA measurement intervals is small for long intervals (no more than five for a 1000-day SMA). Specifically, the success of long-term moving averages depends crucially on the mix of bull-bear market states in the test sample, and this mix may vary considerably over decades. Even random signals usually outperform buy-and-hold in volatile markets (see “The 2000s: A Market Timer’s Decade?”).
- The study ignores S&P 500 dividends, to the disadvantage of buy-and-hold.
- The comparison of multiple complex rules over the same test sample introduces snooping bias, even if out-of-sample with respect to generation of signals.
- The complex trading rules involve substantial computational burdens.