A reader wondered about the value of combining momentum and downside risk avoidance for tactical asset class allocation, as follows:
“One of the methods described in The Ivy Portfolio by Mebane Faber is a simple momentum-based asset class rotation system that shifts monthly into the one, two or three highest performing asset classes based on their performance over an average of the prior 3, 6 and 12 months. Instead of using just the 3, 6 and 12 month prior returns, what if we used an asset class Ulcer Performance Index (UPI): UPI = average return over prior 3, 6 and 12 months / average Ulcer Index (UI) over prior 3, 6 and 12 months. Would this modification identify which asset classes are in low-volatility uptrends and therefore the biggest bang for the buck? Would this allow us to invest comfortably in the top two asset classes, or even the top one asset class, instead of the top three as recommended by Faber?”
Calculation of UI over a rolling interval across a long sample period is cumbersome. As a substitute for UI, we use a standard deviation of downside weekly returns over past intervals for three asset classes: S&P Depository Receipts (SPY), iShares Barclays 20+ Year Treasury Bond (TLT) and iShares Russell 2000 Index (IWM) , with historical data limited to July 2002 (by TLT). Every four weeks, we allocate funds to whichever of SPY, TLT or IWM has the highest ratio of prior return to prior downside standard deviation, or to 13-week Treasury bills (T-bills) if all three past returns are less than the T-bill yield. Using weekly adjusted closes for the asset class proxies over the period 7/31/02 through 8/21/09 (369 weeks or about 89 months), we find that:
In calculating a standard deviation of downside weekly returns over an interval, we set the weekly return to its actual value when the return is negative and to 0% when the return is positive. The ratio of prior return to prior downside standard deviation is generally more discriminating (has larger range across asset classes) than prior return alone.
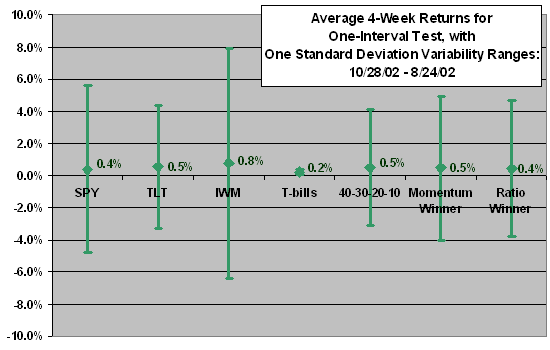
For an initial test, we use only 13-week lagged metrics for asset allocation signals, 13-week past return and downside standard deviation of weekly returns over the past 13 weeks. The following chart summarizes average 4-week returns and variabilities for seven cases over the entire sample period for this one-interval test, as follows:
- Buy and hold SPY.
- Buy and hold TLT.
- Buy and hold IWM.
- Hold T-bills continuously.
- Allocate 40%-30%-20%-10% to SPY-TLT-IWM-Cash, rebalancing every four weeks at the close (40-30-20-10).
- Allocate all funds every four weeks at the close to SPY, TLT, IWM or T-bills based on the highest lagged 13-week return (Momentum Winner).
- Allocate all funds every four weeks at the close to SPY, TLT or IWM based on the highest ratio of lagged 13-week return to lagged 13-week downside standard deviation, or to T-bills if the T-bill yield bears the three returns (Ratio Winner).
The start date of 10/28/02 is based on calculation of 13-week lagged metrics starting 7/31/02.
The winner of this one-interval test based on average 4-week return is buy-and-hold IWM; however, this case also has the highest standard deviation of returns. The other cases are closely bunched. The Ratio Winner has slightly lower average 4-week return and standard deviation of 4-week returns than does the Momentum Winner. The fixed 40-30-20-10 asset allocation approach offers the lowest portfolio variability.
What happens if we use the average of 13-week and 26-week prior returns and the average of 13-week and 26-week prior downside standard deviations instead of just the 13-week lagged results?

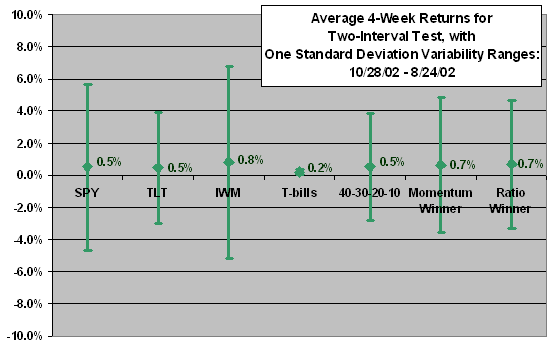
The next chart summarizes average 4-week returns and variabilities for the seven cases over the entire sample period based on averages of 13-week and 26-week lagged metrics. The start date of this two-interval analysis is 2/3/03 based on calculation of 26-week lagged metrics starting 7/31/02.
For this two-interval test, the Momentum Winner and Ratio Winner strategies perform similarly and relatively well in comparison with the 40-30-20-10 strategy and the passive strategies.
What happens if we use the average of 13-week, 26-week and 52-week prior returns and the average of 13-week, 26-week and 52-week prior downside standard deviations?

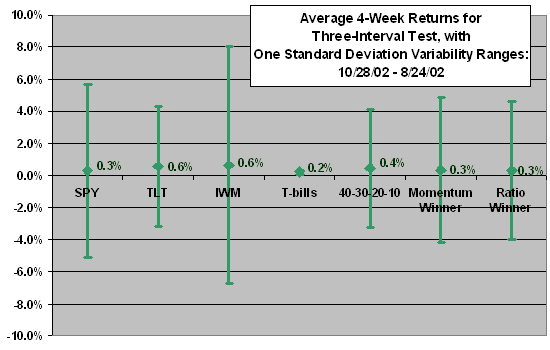
The final chart summarizes average 4-week returns and variabilities for the seven cases over the entire sample period based on averages of 13-week, 26-week and 52-week lagged metrics. The start date of this three-interval analysis is 8/4/03 based on calculation of 26-week lagged metrics starting 7/31/02.
For this three-interval test, the Momentum Winner and Ratio Winner strategies perform similarly but are not strong in comparison with the 40-30-20-10 strategy and some of the passive strategies. It may be that the quicker reactions of the shorter-cycle momentum intervals used above have been better suited to the elevated volatility of the recent bear market.

Note that:
These analyses assume no trading frictions, which would generally be modest for the securities and rebalancing/reallocation frequencies used. However, for small accounts, trading frictions could materially reduce average returns for strategies requiring trading.
The analysis ignores the tax implications of trading, which could be substantial for investors using taxable accounts.
This sample period (spanning roughly one bull and one bear market) is short for evaluating asset class allocation strategies, as suggested by the disparities in results across the three tests. There are only about seven completely independent 52-week intervals in the sample. Testing across multiple business (interest rate) cycles is desirable.
Including more asset classes may improve the performance of the three asset allocation approaches above. Holding multiple asset class winners (rather than just one winner) from a larger selection may hurt or help average returns.
Other ways of calculating downside risk and other combinations of lagged return and downside risk may produce different results. Testing different parameters/parameter settings across the same data set introduces data snooping bias into the distribution of results across cases.
In summary, evidence from simple tests does not support a belief that adding a downside risk factor materially enhances the performance of a momentum-driven tactical asset class allocation strategy.