Does high-frequency trading based on intensive data mining earn huge profits? In their September 2009 paper entitled “Empirical Limitations on High Frequency Trading Profitability”, Michael Kearns, Alex Kulesza and Yuriy Nevmyvaka estimate the maximum possible profit from aggressive high-frequency trading (entry/exit via market orders with holding periods no longer than 10 seconds). They determine potential profit metrics based on high-resolution data for the most liquid NASDAQ stocks and then extrapolate to a large universe of U.S. stocks via regressions on less detailed data. They consistently err on the side of overestimation to define upper bounds on total available profit by: assuming perfect trader hindsight for trade selection; computing optimally profitable trade sizes; excluding exchange fees and broker commissions; and, modeling opportunities in a way that overstates the number of profitable trades. Using a complete set of order placements, cancellations, modifications and trade executions for a set of 19 highly liquid NASDAQ stocks during 2008 and a less granular set of contemporaneous data for other U.S. stocks, they find that:
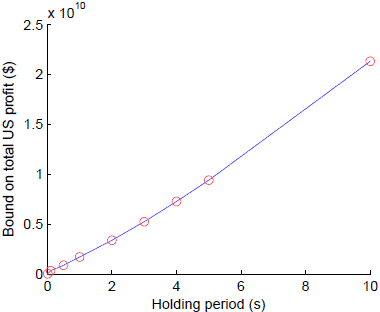
- The upper bound of profit available to aggressive high-frequency trading with a 10-second holding period for a set of 6,279 U.S. stocks during 2008 is about $21 billion. Available profit declines sharply with holding period to just $21 million at 10 milliseconds (see the chart below).
- Across all holding periods, this upper profit bound corresponds to less than 0.05% of U.S. equities trading volume.
- As trading frequency increases (holding period shrinks), available profit plummets because: (1) fewer and fewer opportunities survive the trade-off between holding period and bid-ask spread; and, (2) surviving opportunities have smaller volumes and lower returns.
- Available profit by stock correlates strongly with stock liquidity, and total available profit concentrates strongly in just a few of the most liquid stocks.
- During the 2008 liquidity crisis, bid-ask spreads widened considerably, making it difficult to exploit desperate liquidating parties with aggressive high-frequency trading.
- Applying conservative transaction fees of 0.6 cents per share reduces available profit by about two thirds.
- Applying a reasonable level of market efficiency arguably excludes at least 90% of the profitable trades identified via perfect hindsight. Moreover, real traders make mistakes, offsetting any predictable profit.
- Preliminary (unverified) tests suggest that the profit available to aggressive high-frequency trading in 2009 is only about half that for 2008 (a volatile crisis year).
The following chart, taken from the paper, plots the upper bound of profit available to aggressive high-frequency trading by holding period for 2008. Available profit declines sharply from $21 billion at a 10-second holding period to just $21 million at a 10-millisecond holding period, quantifying the trade-off between holding period and bid-ask spread. These figures are very conservative upper bounds to profits that could be realized in practice.

In summary, evidence from detailed modeling indicates that tension between holding period and bid-ask spread greatly limits the profit available to aggressive high-frequency trading.
More generally, any strategy tested under implicit assumptions of unlimited market capacity and no trading friction warrants great skepticism.