Do time-series (intrinsic) momentum rules for timing stocks beat comparable simple moving average (SMA) rules? In the February 2013 version of their paper entitled “Time-Series Momentum Versus Moving Average Trading Rules”, Ben Marshall, Nhut Nguyen and Nuttawat Visaltanachoti compare and contrast the stock portfolio timing results of intrinsic momentum and SMA rules. They compare intrinsic momentum timing rules that buy (sell) when price moves above (below) its value 10, 50, 100 or 200 trading days ago to SMA timing rules that buy (sell) when price moves above (below) its SMA over the same look-back intervals. They focus on a long-only strategy applied to five value-weighted size (quintile) portfolios of U.S. stocks, switching to U.S. Treasury bills (T-bill) when on sell signals. As an alternative, they consider shorting stocks when on sell signals. They also test some timing rules on ten international stock markets (Australia, Canada, France, Germany, Italy, Japan, the Netherlands, Sweden, Switzerland and the UK). Using data for U.S. size portfolios from Ken French’s website during 1963 through 2011 and for international stock market indexes during 1973 through 2011, along with contemporaneous T-bill yields, they find that:
- Intrinsic momentum and counterpart SMA rules are closely related, with long-only return correlations generally in excess of 0.8. These large correlations hold for different sub-periods, recessions and expansions, bull and bear stock markets and international market indexes.
- SMA rules tend to generate higher gross returns, gross Sharpe ratios and gross alphas than their intrinsic momentum counterparts by entering and exiting stocks sooner.
- For the long-only strategy applied to U.S. size portfolios (see the chart below):
- The average holding periods for look-back intervals of 10, 50, 100 and 200 trading days are 8, 22, 31 and 47 days for SMA rules and 10, 32, 46 and 83 for intrinsic momentum rules, respectively.
- SMA rules consistently generate higher gross average returns than do intrinsic momentum counterparts, with outperformance shrinking as size increases. Across all look-back intervals, SMAs outperform by 0.33% (0.12%) per month for the smallest (biggest) quintile.
- Gross average monthly returns from timing rules generally decrease as look-back interval increases. Across all quintiles, the gross average monthly return is 1.58% (1.04%) for the 10-day (200-day) look-back interval.
- Gross average monthly returns generally decrease as size increases for both intrinsic momentum and SMA rules. Across all rules, the gross average monthly return is 1.64% (0.77%) for the smallest (biggest) quintile.
- Return volatilities are similar for intrinsic momentum and SMA rule counterparts, generally decreasing as size increases.
- Gross Sharpe ratios and gross four-factor (market, size, book-to-market, momentum) alphas are generally higher for SMA rules than for their intrinsic momentum counterparts.
- Both intrinsic momentum and SMA rules considerably reduce downside risk. For example, during the worst (second worst) buy-and-hold month of October 1987 (August 1998), the timing rules applied to the smallest quintile lose less than 1% (produce a small gain). Both sets of rules exit long positions prior to sustained market downturns.
- Results are robust in different subperiods, across the business cycle and when holding positions for fixed intervals after signals.
- Breakeven one-way trading frictions for intrinsic momentum (SMA) timing rules applied to the smallest quintile range from 0.96% (0.95%) for the 10-day look-back interval to 3.85% (3.67%) for the 200-day look-back interval. Applied to the second biggest quintile, these thresholds fall to 0.51% (0.58%) and 2.89% (2.33%), respectively.
- The alternative long-short strategy applied to U.S. size portfolios generally outperforms the long-only strategy on a gross basis for both SMA and intrinsic momentum rules, most noticeably for scenarios with the strongest gross performance (such as 10-day look-back for the smallest quintile).
- For the long-only strategy with 50-day look-back interval, correlations between returns for intrinsic momentum and SMA rule counterparts range from 0.86 to 0.90 across international markets, with average holding periods longer for the former. Gross average monthly returns and gross Sharpe ratios are higher for SMA rules than intrinsic momentum rules in all countries.
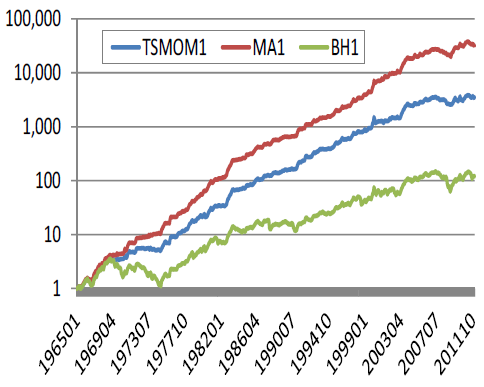
The following chart, taken from the paper, compares the gross cumulative performance of buying and holding the smallest quintile of U.S. stocks (BH1) to those of long-only intrinsic momentum (TSMOM1) and SMA (MA1) timing rules based on a 50-day look-back period. Both timing rules beat buy-and-hold, and the SMA rule outperforms its intrinsic momentum counterpart.
Differences in gross performance generally shrink as size increases, with order of gross performance consistent except for the biggest quintile (where intrinsic momentum does not beat buy-and-hold).
In summary, evidence indicates that stock portfolio timing rules based on SMAs generally outperform rules based on intrinsic momentum counterparts.
Cautions regarding findings include:
- The study employs indexes rather than tradable assets. Including the costs of creating and maintaining funds to track these indexes would reduce all returns.
- Based on the breakeven trading frictions, timing rules based on short look-back intervals (which generate many trades) as applied to a long-only strategy for U.S. stock size quintiles may not be profitable. Trading frictions are likely higher early in the sample period than later and mostly higher for small stocks than large stocks.
- Given uncertainties regarding the feasibility of shorting stocks (as noted in the paper) and the costs of shorting, the long-short strategy variations may not be profitable.
- The methodology apparently assumes no delay between timing signal calculation and trade execution. This assumption may be problematic.
- It is reasonable to argue that the intrinsic momentum signal threshold should be the risk-free rate rather than zero return.
For related research, see “Intrinsic Momentum or SMA for Avoiding Crashes?”, “Optimal Intrinsic Momentum and SMA Intervals Across Asset Classes” and “24-Month SMA Effectiveness Verification Tests”.