Is a 10-month simple moving average (SMA10) the best SMA for long-term crossing signals? If not, is there some other optimal SMA lookback interval? To check, we compare performance statistics for SMA crossing signals generated by lookback intervals ranging from 2 (SMA2) to 48 months (SMA48), as applied to the S&P 500 Index. Using monthly S&P 500 Index closes, monthly S&P 500 Composite Index dividend data from Robert Shiller and monthly average yields for 3-month Treasury bills (T-bills) during January 1928 (except January 1934 for T-bills) through June 2020, we find that:
Assumptions are:
- When the S&P 500 Index closes above (below) its SMA at the end of a month, put funds in index stocks (cash) from that close through the next month, requiring slight anticipation of crossing signals.
- Use a common start date of January 1932 for SMA performance calculations (accommodating SMA48).
- Use the contemporaneous T-bill yield as the return on cash. For 1932-1933, when the T-bill yield is not available, assume zero return on cash.
- Estimate the monthly dividend yield on S&P 500 Index stocks as one twelfth the annual yield from Robert Shiller’s data. Dividend reinvestment is immediate and frictionless.
- Ignore tax implications of trading.
- Treat stocks-cash switching frictions as constant over the sample period.
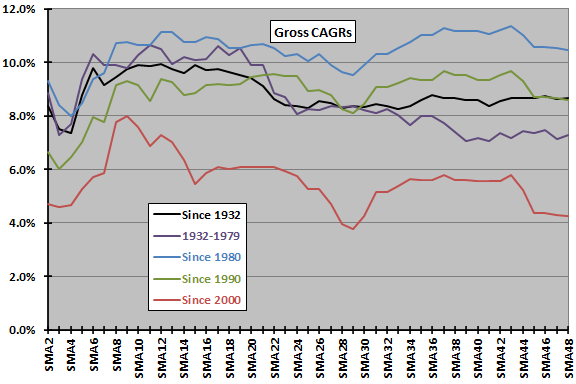
The following chart plots average gross monthly total returns (including dividends) for SMA lookback intervals ranging from 2 to 48 months over the full sample period and four subperiods. The chart mostly suggests that the optimal SMA lookback interval is in the range 8 to 24 months. For the most recent subperiod, SMA9 is optimal. However, differences across subperiods show that there is no consistently optimal SMA lookback interval.
The average gross monthly return for the optimal SMA interval is lower than that for a buy-and-hold strategy over the entire sample period (0.85% versus 1.00%). Over most subperiods, the optimal SMA interval is close to that of buy-and-hold.
How does return variability vary with SMA lookback interval?
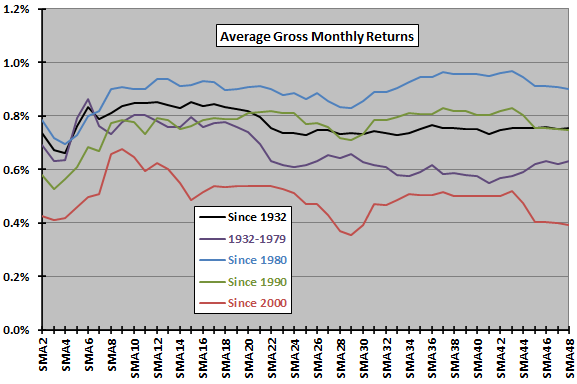
The next chart plots the standard deviations of monthly returns for SMA lookback intervals ranging from 2 to 48 months over the full sample period and four subperiods. Except for the oldest data, shorter SMA lookback intervals suppress volatility more than longer ones.
Across all subperiods except the oldest data, SMA lookback intervals with the most volatile returns are still materially less volatile than corresponding buy-and-hold volatilities.
Does a combination of reward and risk isolate an optimal SMA lookback interval?
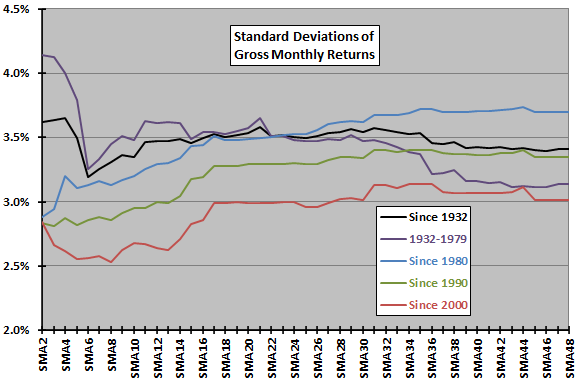
The next chart plots ratios of average gross monthly returns to standard deviations of monthly returns (reward/risk) for SMA lookback intervals ranging from 2 to 48 months over the full sample period and four subperiods. The chart mostly suggests that the optimal SMA lookback interval is in the range 6 to 21 months. For the most recent subperiod, SMA8 and SMA9 are optimal. However, differences across subperiods again show that there is no consistently optimal SMA lookback interval.
For the full sample period and all subperiods, the optimal SMA lookback interval beats buy-and-hold based on gross reward/risk, most dramatically for the most recent subperiod.
For another perspective we compare compound annual growth rates (CAGR) across SMA lookback intervals.
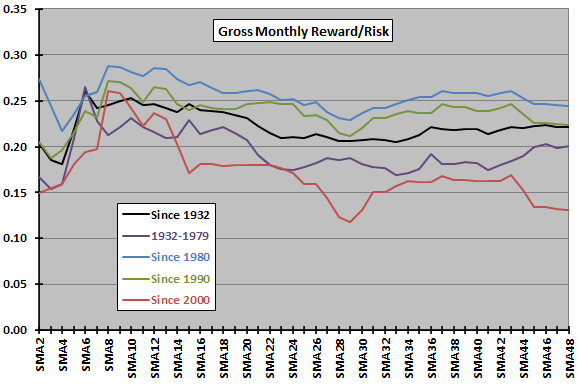
The next chart plots gross CAGRs for SMA lookback intervals ranging from 2 to 48 months over the entire sample period and four subperiods. The chart mostly suggests that the optimal SMA lookback interval is in the range 9 to 21 months. For the most recent subperiod, SMA9 is optimal. However, differences across subperiods again show that there is no consistently optimal SMA lookback interval.
For the full sample period and all subperiods except Since 1980, the optimal SMA lookback interval beats buy-and-hold based on gross CAGR, most dramatically for the most recent subperiod.
What happens when we consider switching frictions?
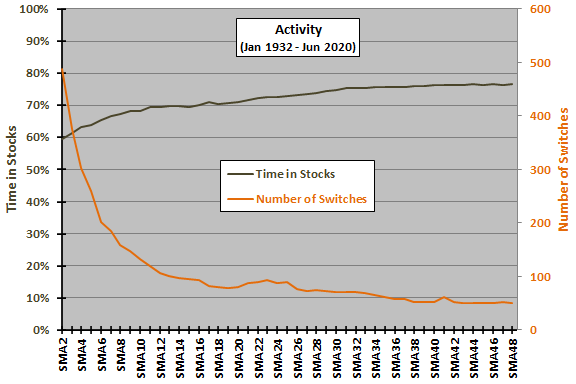
The next chart plots percentage of time in stocks (left axis) and number of switches (right axis) for SMA lookback intervals ranging from 2 to 48 months over the entire sample period. Time in stocks increases gradually, and number of switches decreases (first dramatically and then slowly), with the length of the SMA lookback interval.
How does variation in activity translate to variation in net performance?
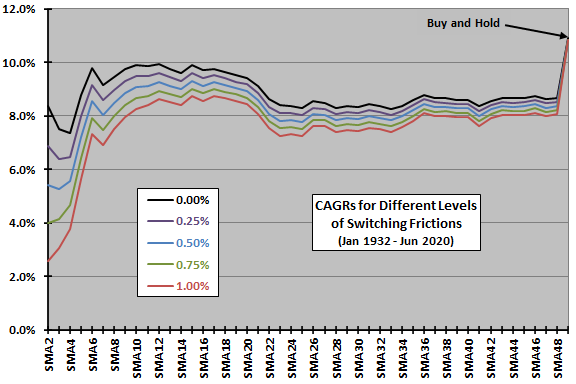
The next chart plots net CAGRs over the full sample period for SMA lookback intervals ranging from 2 to 48 months and for constant levels of one-way switching frictions ranging from 0% to 1%. Because of the number of switches, frictions degrade performance for shorter SMA lookback intervals more rapidly than for longer intervals.
How does maximum (peak-to-trough) drawdown (MaxDD) vary with SMA lookback interval?
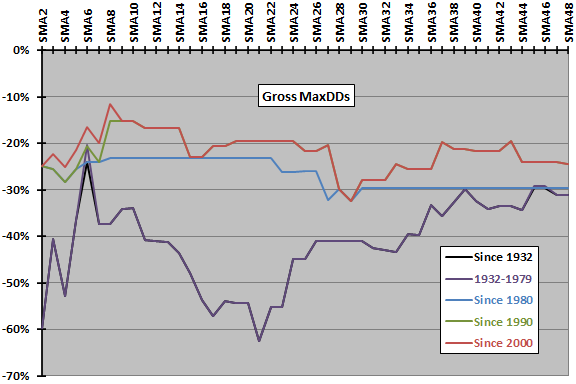
The final chart plots gross maximum drawdowns based on monthly returns for SMA lookback intervals ranging from 2 to 48 months over the full sample period and four subperiods. Except for the oldest data, shorter SMA lookback intervals suppress maximum drawdown better than longer ones. Results suggest optimality in the range 6 to 24 months.
For buy-and-hold, maximum drawdown is -51% for all samples, driven by the 2008-2009 crash.
In summary, evidence from simple tests suggests a fairly wide range of “optimal” SMA lookback intervals for generating crossing signals to exploit long-term U.S. stock market trends.
Results (and logic) suggest that subperiods that are relatively bullish (bearish) tend to favor long (short) SMA lookback intervals. Risk-averse investors who use SMAs may therefore prefer shorter rather than longer lookback intervals.
However, tax-sensitive investors who use SMAs may prefer longer lookback intervals to suppress trading.
Cautions regarding findings include:
- The sample period is not long in terms of number of equity bear markets to avoid. It is also not long for the longest-interval SMAs in terms of number of independent measurement intervals.
- Dividend accrual and reinvestment assumptions are simplified and may affect findings.
- Switching frictions vary considerably over the sample period (see “Trading Frictions Over the Long Run”). The simplifying assumption of constant friction may affect findings.
- Findings may differ for other equity indexes, other sample periods and other asset classes. For example, see “Optimal Intrinsic Momentum and SMA Intervals Across Asset Classes”.