Is technology driving the profitability of technical rules in financial markets from low-frequency trading to high-frequency trading? In his March 2007 paper entitled “The Profitability of Technical Stock Trading Has Moved from Daily to Intraday Data”, Stephan Schulmeister investigates how well 2,580 widely used trend-following and contrarian technical trading rules (moving average, momentum and relative strength) exploit trend and reversal behavior of the S&P 500 Index futures markets. In estimating trading returns, he assumes: (1) that futures positions roll on the tenth day of the month from the expiring contract to the contact expiring three months later, and (2) that trading friction is 0.01% per trade. Using daily open (30-minute) data for the S&P 500 Index spot (futures) prices during 1960-2000 (1983-2006), he finds that:
- Technical trading of the S&P 500 Index spot market based on daily prices is not attractively profitable during 1960-2000, with the 2,580 rules tested generating an average annual gross return of only 1.9%.
- The number of profitable trades is always smaller than the number of unprofitable trades, and the magnitude of the average return per day for profitable trades is lower than that for unprofitable trades. However, the average duration of profitable trades is several times longer than that of unprofitable trades. In other words, profits from relatively infrequent but persistent gains more than offset losses from many brief price fluctuations.
- Annual gross profitability declines steadily from 8.6% for 1960-1971 to 2.0% for 1972-1982 to 0.0% for 1983-1991 to –5.1% for 1992-2000.
- Technical trading of S&P 500 Index futures based on daily prices during 1983-2000 is less profitable than spot market trading, generating an average annual gross return of -5.9% (compared to -2.5% for the spot market over the same period).
- The best-performing rules in both spot and futures markets are those focused on short-term price trend.
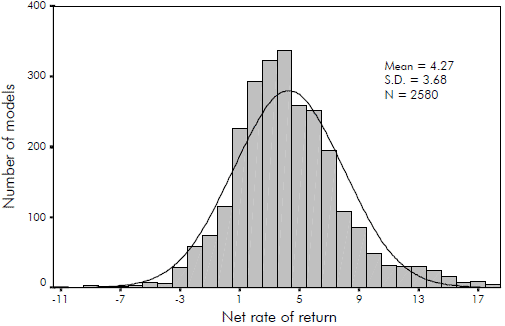
- But, technical trading of S&P 500 Index futures based on 30-minute data is notably profitable, with the 2,580 rules tested generating an average annual gross return of 8.8% during 1983-2000. The large number of transactions involved results in a substantially lower 4.3% average annual net return (see the chart below), translating (with a 10% margin requirement) to a 43% net average annual return on invested capital.
- Profitable trades are on average 35% less frequent than unprofitable trades, but their average duration is 2.74 times longer. Again, profits from relatively infrequent but persistent gains exceed the losses from many brief price fluctuations.
- The probability of realizing an overall loss when strictly following most of the rules is close to zero.
- Contrarian rules generally outperform trend-following rules (10.9% versus 6.4% average annual gross return). However, contrarian rules incur greater compounded trading friction because they concentrate on very short-term price trends, reducing their average annual net return advantage over trend-following rules to 5.5% versus 3.5%.
- The 5.8%/24.5%/69.7% of the 2,580 rules with the shortest/next-shortest/longest trade durations generate average annual gross returns of 17.1%/12.5%/6.9%, respectively. However, different rates of compounding trading frictions reduce return differences on a net basis.
- The 25 models that perform best over the last subperiod (18.7% average annual gross return) tend to continue outperforming over the next subperiod (9.6% average annual gross return).
- However, during a 2001-2006 out-of-sample test based on 30-minute data for S&P 500 Index futures, the 2,580 rules perform much worse than during 1983-2000, perhaps because stock markets become more efficient or because stock price inefficiencies shift from 30-minute intervals to higher frequencies. For this out-of-sample test:
- The average annual gross (net) return is 0.9% (-3.8%).
- Gross profitability declines from 5.4% during 2001-2003 to -2.9% during 2004-2006.
- The 25 best-performing models no longer exhibit next-period outperformance.
- Trends in stock index futures prices are arguably shrinking in duration, perhaps now exploitable only for sampling intervals smaller than 30 minutes.
The following chart, taken from the paper, shows the net profitability distribution for the 2,580 technical rules applied to S&P 500 Index futures trading during 1983-2000. While the rules produce a average annual gross return of 8.8%, the large number of transactions reduces the average annual net return down to 4.3%.

In summary, evidence from the past few decades indicates that professional technical traders using high-frequency data may well earn abnormal returns in the S&P 500 Index futures market. However, other traders may fail because they use lower-frequency data, bear higher trading friction and are less resilient to losses.
Plausible extrapolation of findings to 2007-2010 suggests a further shift of abnormal returns from technical rules toward very high-frequency trading.
Reservations regarding these findings are:
- Return calculation assumptions for S&P 500 Index daily spot market trading are unclear.
- While using subperiods and out-of-sample tests to address data snooping bias, the paper does not explicitly correct for this bias (see the summaries of Chapters 6 and 8 in “Evidence-Based Technical Analysis: Applying the Scientific Method and Statistical Inference to Trading Signals (Chapter-by-Chapter Review)”).
- Significance test statistics assume a normal distribution of returns. To the extent the actual distribution of returns is non-normal, the confidence inferred from those statistics may mislead.
- Retail traders may bear higher futures trading friction than assumed.
See “A Few Notes on Trading Realities” for relevant but narrower discussion on exploitation.