Is there a way to mitigate adverse impact of price trajectory turning points (trend changes) on performance of intrinsic (absolute or time series) momentum strategies? In their May 2020 paper entitled “Breaking Bad Trends”, Ashish Garg, Christian Goulding, Campbell Harvey and Michele Mazzoleni measure impact of turning points on time series momentum strategy performance across asset classes. They define a turning point as a month for which slow (12-month or longer lookback) and fast (3-month or shorter lookback) momentum signals disagree on whether to buy or sell. They test a dynamic strategy to mitigate trend change impact based on turning points defined by disagreement between 12-month (slow) and 2-month (fast) momentum signals. Specifically, their dynamic strategy each month:
- For each asset, measures slow and fast momentum as averages of monthly excess returns over respective lookback intervals.
- Specifies the trend condition for each asset as: (1) Bull (slow and fast signals both non-negative); (2) Correction (slow non-negative and fast negative); Bear (slow and fast both negative); and, Rebound (slow negative and fast non-negative). For Bull and Bear (Correction and Rebound) conditions, next-month return is the same (opposite in sign) for slow and fast signals.
- After trend changes (Corrections and Rebounds separately), empirically determines with at least 48 months of historical data optimal weights for combinations of positions based on slow and fast signals.
They compare performance of this dynamic strategy with several conventional (static) time series momentum strategies, with each competing strategy retrospectively normalized to 10% test-period volatility. They test strategies on 55 futures, forwards and swaps series spanning four asset classes, with returns based on holding the nearest contract and rolling to the next at expiration. Using monthly returns for futures, forwards and swaps for 12 equity indexes, 10 bond indexes, 24 commodities and 9 currency pairs as available during January 1971 through December 2019, they find that:
- The more turning points in the test period for an asset, the worse the performance of a 12-month times series momentum strategy for the asset. When the number of annual turning points is six or more, median momentum strategy return is negative.
- There is no relationship between number of turning points in an asset’s time series and its return volatility.
- The frequency of turning points is higher over the past decade than for previous decades, helping to explain the relatively weak recent performance of time series momentum.
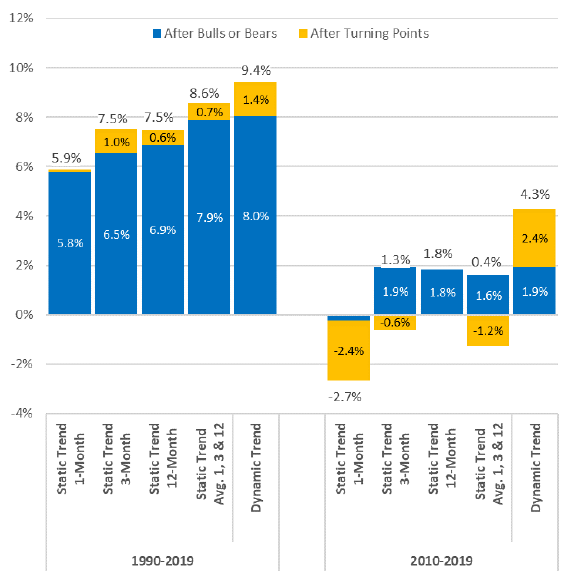
- A dynamic multi-asset time series momentum strategy more than doubles average gross returns of conventional strategies over the last decade (see the chart below). For example:
- A conventional strategy based on 12-month lookback generates 7.5% (1.8%) annualized average gross monthly return over the last 30 (10) years, with performance largely derived from months after Bull or Bear conditions.
- The dynamic strategy generates 9.4% (4.3%) annualized average gross monthly return over the last 30 (10) years, with enhanced performance after turning points.
- Findings generally hold for conventional strategies based on other lookback intervals.
The following chart, taken from the paper, breaks down multi-asset time series momentum annualized gross monthly performance over the last 30 years and over the last 10 years for the dynamic strategy and four conventional strategies. Conventional strategy momentum signals are 1-month return, average monthly return over the last three months, average monthly return over the last 12 months and the average signal for these three lookback intervals. Returns for all strategies assume retrospective scaling to achieve 10% annualized monthly volatility over the test period. Results indicate that the dynamic strategy beats conventional strategies by performing better after trend changes (Corrections and Rebounds).
In summary, evidence indicates that modifying effective lookback interval for intrinsic (time series) momentum when slow and fast signals disagree may enhance strategy performance.
Cautions regarding findings include:
- Performance data are gross, not net. Accounting for frictions from strategy long-short switching would reduce all returns. The dynamic strategy likely has higher turnover than a slow conventional strategy.
- Returns based on full test period volatility scaling as described may differ materially from actual raw (unscaled) performance.
- Subsamples for Correction and Rebound conditions may be small, undermining confidence in reliability of derived weights for associated momentum signals.
- Testing many strategies on the same sample introduces data snooping bias, such that the best-performing strategy overstates expectations.
- Iterative optimization of Correction and Rebound momentum signal weights may be beyond the reach of some investors, who would bear fees for delegating the work to a fund manager.
See also “Asset Class Momentum Faster During Bear Markets?”.