Pairs trading seeks to exploit temporary divergences in price between two assets that historically track very closely, taking long/short positions in the relatively undervalued/overvalued pair member to generate small steady profits at low risk. How profitable is this concept in implementation? In his November 2010 paper entitled “Pairs Trading in the Land Down Under”, Timofei Bogomolov measures the profitability of the three most cited methods of pairs trading as applied to Australian stocks. All three methods: (1) employ a 12-month rolling window of historical data to select the best five and 20 pairs to trade based on statistical measures of similarity; (2) open trades on selected pairs during the next six months whenever pair prices diverge by a statistically large spread; and, (3) close trades when the spread disappears/diminishes, confidence in pair tracking degrades or the six-month trading interval ends. Using daily price data for 55 to 300 liquid Australian stocks for trading over the period January 1998 through May 2010, he finds that:
- Over the entire sample period, all three methods produce statistically significant gross monthly average returns on committed capital ranging from 0.38% to 1.05% (0.45% to 0.63%) for the top five (20) pairs. Standard deviations of monthly returns range from 1.2% to 3.1%, with gross Sharpe ratios of 0.20 to 0.54. Over the same period, the ASX 200 Index has an average monthly return of 0.32%, with standard deviation 3.85% and Sharpe ratio 0.08. All three pairs trading methods have very low negative correlations with the ASX 200 Index and market betas close to zero.
- However, after accounting for 0.15% one-way transaction costs (no bid-ask spread), two pairs trading methods are unprofitable. The best-performing method produces net monthly average returns on committed capital of 0.8% (0.5%) for the top five (20) pairs.
- Results include the global financial crisis from the beginning of 2008 until the middle of 2009, during which two of the three pairs trading methods generated annualized returns on committed capital over 25%. A November 2008 through May 2009 ban on short selling may have distorted the trading models.
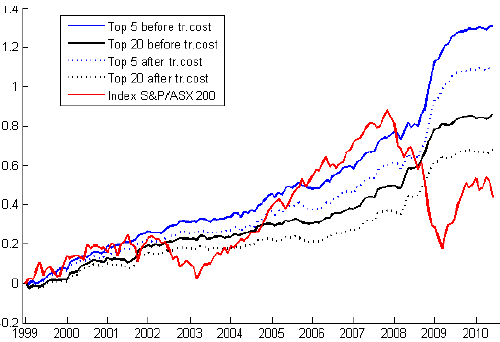
The following chart, taken from the paper, summarizes cumulative return on committed capital, with and without transaction costs, for the best-performing of the three pairs trading methods tested. This method: (1) employs a 12-month rolling window of historical data to select the best 5 and 20 pairs to trade based on smallest standard deviations of daily differences in log prices; (2) opens trades on selected pairs during the next six months whenever pair log prices diverge by two standard deviations; and, (3) closes trades when the spread disappears or the six-month trading interval ends. Results show that pairs trading often, but not always, beats buying and holding the index on a cumulative return basis. In other words, this cumulative return contest is sensitive to start and stop dates.

In summary, evidence from pairs trading tests on liquid Australian stocks offers mixed support for a belief that pairs trading reliably generates attractive profits under recent market conditions.
The author further concludes, without proof, that: “the general idea of pairs trading is sound. So, better criteria of pairs selection and rules of trading could be developed.”
Note that:
- Testing of three methods on the same data set introduces data snooping bias, such that the performance of the best method modestly overstates reasonable expectations. Adding variations to incorporate “better criteria of pairs selection and rules of trading” would increase this bias.
- Interpretations of the statistical methods used to measure pair relationships imply well-behaved (e.g., normal) distributions of stock returns. To the extent actual return distributions are non-normal, these interpretations lose theoretical predictive power.