Do trading rules based on price relative to intermediate-term and long-term simple moving averages (SMA) outperform a buy-and-hold approach for all kinds of stocks and stock portfolios? In the January 2013 update of his paper entitled “Market Timing with Moving Averages”, Paskalis Glabadanidis examines SMA performance based on monthly returns. He uses an SMA measurement interval of 24 months for most analyses, but includes robustness tests for intervals of 6, 12, 36, 48 and 60 months. He enters (exits) a stock portfolio or individual stock whenever its monthly closing level is above (below) its SMA. When not in stocks, funds earn the contemporaneous 30-day U.S. Treasury bill yield. He applies a trading friction of 0.5% of portfolio value when entering and exiting positions. He focuses on portfolios of U.S. stocks sorted/ranked monthly by nine stock/firm characteristics: market value (size); book-to-market ratio; cash flow-to-price ratio, earnings-to-price ratio, dividend-price ratio, short-term reversal, medium-term momentum, long-term price reversal and industry classification. As robustness tests, he considers individual U.S. stocks and market and characteristic-sorted portfolios of stocks from seven non-U.S. developed countries (Australia, Canada, France, Germany, Italy, Japan and UK). Using monthly returns for value-weighted portfolios sorted by the above characteristics (from the Ken French Data Library) and for 18,397 individual U.S. stocks during 1960 through 2011, and monthly portfolio returns for the seven country markets mostly during 1975 through 2010, he finds that:
- For U.S. characteristic-sorted portfolios:
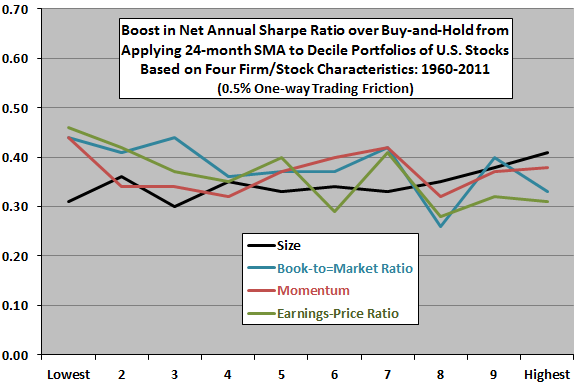
- The 24-month SMA rule dominates a buy-and-hold approach in terms of Sharpe ratio across value-weighted portfolios formed by sorts as described above (see the chart below). The SMA rule consistently generates higher average annualized gross return, lower standard deviation of returns and more positive skewness than buy-and-hold.
- Because the SMA rules do not trade frequently, breakeven trading frictions are large, roughly in the range 3% to 9% per trade.
- SMA rule outperformance persists after adjustment for commonly used risk factors (market, size, book-to-market, momentum), with net annual four-factor alphas in the range 3%-7%.
- There may be material variations in SMA rule performance across deciles for some sorts.
- Results are generally robust for different SMA measurement intervals up to 36 months. However, in terms of average annualized excess return (relative to buy-and-hold), net performance generally degrades as SMA measurement interval lengthens.
- Results are robust for two equal subperiods and use of daily rather than monthly data in SMA calculations. Investor sentiment, liquidity, business cycle and market state (bull-bear) affect but do not fully explain rule performance.
- Results are generally robust to the use of Monte Carlo simulation and bootstrapping in place of time-series returns.
- Combining several SMA strategies on a value-weighted or equal-weighted basis further enhances performance.
- The performance of SMA rules for individual stocks is similar, with increases in gross return and decreases in risk compared to buy-and-hold, and break-even transaction costs for 15,000 stocks between 0.5% and 1.5%.
- Results are also generally similar for the seven non-U.S. countries, both for market portfolios and for portfolios ranked by book-to-market ratio, earnings yield, dividend yield and cash flow-to-price ratio. SMA rules again increase gross return and decrease risk, with large break-even transaction costs. Outperformance is clearly stronger for (volatile) growth portfolios than for value portfolios.
The following chart, constructed from data in the paper, summarizes the boost in Sharpe ratios relative to a buy-and-hold approach from a 24-month SMA entry/exit rule applied to value-weighted decile portfolios generated by separate sorts of a broad sample of U.S. stocks according to firm size, book-to-market ratio, annual return momentum (with skip-month) and earnings-price ratio over the period 1960 through 2011. Calculations assume one-way trading friction of 0.5% for rule execution. Results suggest that the SMA rule beats buy-and-hold for all kinds of stocks.

In summary, evidence indicates that long-term SMA rules pervasively outperform a buy-and-hold approach for different kinds of stocks and stock portfolios, perhaps due largely to some cyclical aspect of equity markets.
Cautions regarding findings include:
- While arguably conservative for U.S. stocks over the past two decades (for large investors), the assumed 0.5% trading friction may be too low for much of the sample period, even for the largest capitalization stocks (see “Trading Frictions Over the Long Run”).
- Results may be sensitive to any delay between signal and execution, which the study apparently assumes to be zero.
- Testing many rules/sorts on the same or highly correlated data introduces data snooping bias, such that the best (worst) combination likely overstates (understates) reasonable out-of-sample expectations.
- Findings may not apply to asset classes other than stocks (see, for example, “Use ‘Standard’ SMAs to Identify Gold Market Regimes?”).
For simpler overall U.S. stock market-level analyses, see “10-Month SMA Timing Signals Over the Long Run” and “10-Month SMA Timing Signals Over the Short Run”.