A reader inquired about a test of the BMW Method, defined as follows:
“I trust the CAGR. That is the compound average growth rate. I look back 30 years to get a base number to work from and I then calculate the range of CAGR’s that encompass the full range of stock prices over that 30 year period. The curves are extended into the future by 5 to 10 years and I have a complete picture of what has been and what can be if the business just rolls on along. I buy stocks when they are priced significantly below the lowest historical 30 year CAGR. It happens often. If I cannot find a business that is significantly below the low CAGR, I will settle for some that are on their 30 year lows or just below that level. These do not enthuse me nearly as much, but they will rebound also. The history proves it. This is a definite buy low, sell high concept…except it works. In fact, I want anyone to explain in detail how it cannot work.”
This description is not a precise specification. To test the underlying concept, we hypothesize that the short-term compound growth rate of a broad market index tends to revert to a longer-term compound growth rate. If we enter the market after intervals of relatively low short-term growth and exit after intervals of relatively high short-term growth, we may be able to outperform a buy-and-hold strategy. We use the S&P 500 index to represent the stock market because of its long history. For trading precision we use daily closing levels of the index, with one-year intervals for the short-term growth trend and 30-year and five-year intervals for the long-term growth trend. Using S&P 500 index closing levels for 1/3/50 through 3/3/08, we find that…
We consider two strategies.
1-30 Crossover:
- Buy the S&P 500 index on the first date that the one-year lagging compound daily growth rate of the index crosses above its 30-year lagging compound daily growth rate. This cross above potentially signals the end of an interval of abnormally low price appreciation.
- Sell the S&P 500 index on the first subsequent date that the one-year lagging compound daily growth rate of the index crosses below its 30-year lagging compound daily growth rate. This cross under potentially signals the end of an interval of abnormally high price appreciation.
- Repeat these two steps across the entire test period.
- Whenever out of the index, assume a daily return on cash equal to the contemporaneous 90-day Treasury bill (T-bill) yield.
- Ignore trading fees/frictions (since there are very few transactions).
- Start the exercise on 1/2/80 (allowing 30 years of pre-test history) with a “Buy” since the short-term growth rate is above the long-term growth rate.
1-5 Crossover: This alternate strategy is exactly the same as above, except that it uses a five-year compound daily growth rate for the long-term trend. A five-year growth rate may help catch some trends obscured by the 30-year growth rate.
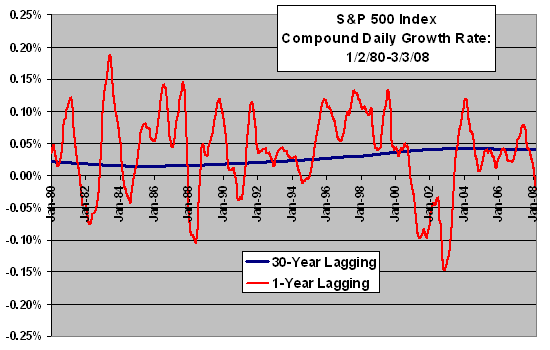
The following chart depicts the behavior of the long-term and short-term compound daily growth rates for the 1-30 Crossover strategy. This strategy generates 24 transactions (12 round trips) over the entire 28-year test period. The 12 round trips produce 11 gains (with the largest 173% in the second half of the 1990s) and just one loss (-3.4% in mid-2000). The average holding period is 527 days, ranging from a low of 23 days to a high of 1,803 days.
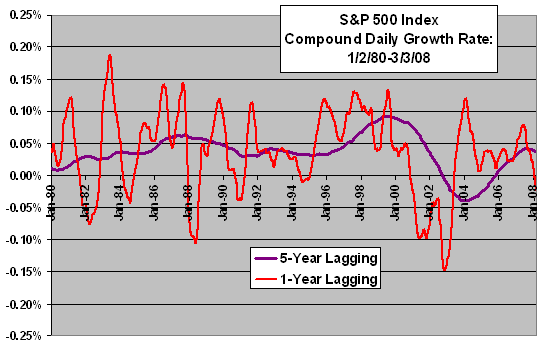
The next chart shows the behavior of the long-term and short-term compound daily growth rates for the 1-5 Crossover strategy. This strategy generates 26 transactions (13 round trips) over the entire 28-year test period. The 13 round trips produce nine gains (with the largest 101% in the mid-1990s) and four losses (with the largest -14.8% in 1987). The average holding period is 436 days, ranging from a low of seven days to a high of 1,257 days.
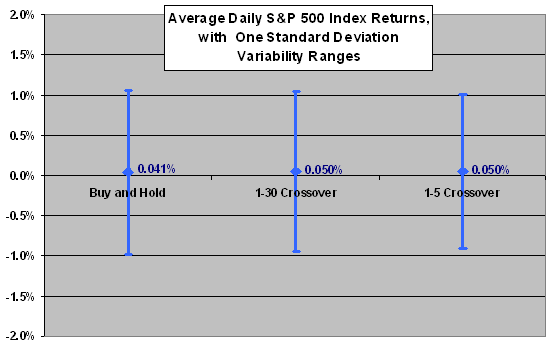
The next chart summarizes the average daily S&P 500 index returns and variabilities for the two crossover strategies and a benchmark buy-and-hold strategy. It shows that the crossover strategies do identify periods of somewhat higher than normal average daily returns. There is little difference in daily return volatility among the three strategies.
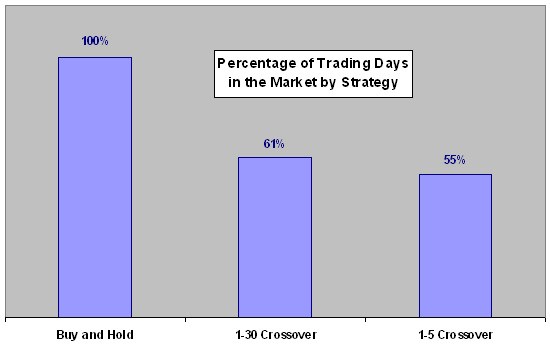
The next chart summarizes the percentages of trading days spent in stocks for these same three strategies. Of the 7,108 trading days in the test period, the 1-30 Crossover strategy is in stocks 4,370 days (61%) and out of stocks 2,737 days (39%). The 1-5 Crossover strategy is in stocks 3,922 days (61%) and out of stocks 3,185 days (45%).
How do the three strategies compare with respect to standalone cumulative returns?
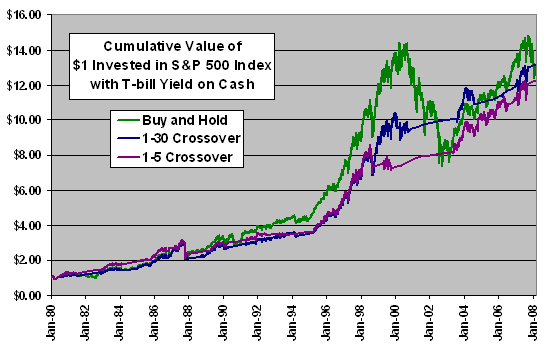
The final chart plots the cumulative value of $1 initial investments made at the close on 1/2/80 for all three strategies, reflecting both the returns while in stocks and the percentages of trading days spent in stocks. Returns for the 1-30 Crossover and 1-5 Crossover trading strategies include the T-bill yield on cash when out of stocks. The chart shows that the cumulative returns of the three strategies are close at the end of the 28-year test period. The crossover trading strategies may tend to underperform during high-growth bursts but outperform during downturns, lending them some appeal on an annual risk-adjusted basis. Relative performance is sensitive to the start date of the test.
Note that T-bill yields were extraordinarily high in the early 1980s.
Other “long” and “short” interval lengths may result in stronger cumulative returns, with data mining bias growing with the number of alternatives considered.
In summary, limited tests indicate that a strategy based solely on historical price data that seeks to exploit (avoid) periods of likely above-normal (below-normal) price growth has some merit. However, evidence does not support a belief that such a strategy can reliably outperform a buy-and-hold approach over long periods.