A reader proposed: “I recently found something interesting while analyzing the ratio of the equal-weighted S&P 500 Index to its market capitalization-weighted counterpart. Whenever this ratio declines (out of an uptrend), the market crashes (July 2007, September-October 2008, July 2011). Also, when this ratio starts rising, the recovery commences (April 2009). The indicator seems to warn of problematic times ahead. …Perhaps this ratio provides insight into whether money is moving into the market (ratio rising) or out of the market (ratio falling). Could you take a look at this to see whether this ratio is a great indicator?” To investigate, we use SPDR S&P 500 (SPY) and Invesco S&P 500 Equal Weight (RSP) as tradable proxies for the capitalization-weighted and equal-weighted S&P 500 Index, respectively. Using weekly dividend-adjusted prices of SPY and RSP from the end of April 2003 (limited by RSP) through July 2018 (796 weeks), we find that:
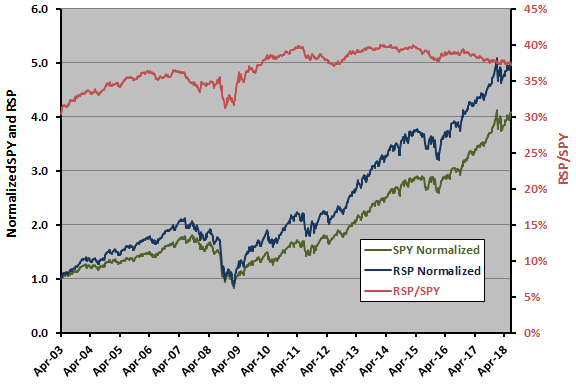
The following chart compares SPY, RSP and RSP/SPY over the available sample period using weekly data. Results indicate that:
- RSP outperforms SPY based on terminal value.
- RSP has higher average weekly return (0.24% verus 0.20%), but also higher volatility (standard deviation of weekly returns 2.55% versus 2.28%).
- RSP has the large maximum drawdown (-60% versus -55%).
- RSP/SPY rises overall, but not over some extended subperiods.
Visual inspection does not show whether RSP/SPY leads SPY.
For precision (and because RSP/SPY may not have a stable average), we relate change in RSP/SPY to SPY return.
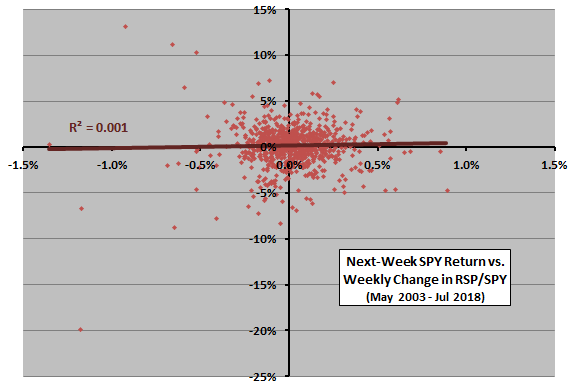
The following scatter plot relates next-week SPY return to weekly change (difference, not percentage) in RSP/SPY over the available sample period. The Pearson correlation between the two series is 0.03 and the R-squared statistic 0.001, indicating that weekly change in RSP/SPY explains 0.1% (practically none) of the variation in next-week SPY return. This result does not support belief in the power of change in RSP/SPY to predict stock market return at a weekly horizon.
However, it appears that near-term stock market volatility may be relatively high after large drops in RSP/SPY.
Might the effect of changes in RSP/SPY take more than one week to appear?
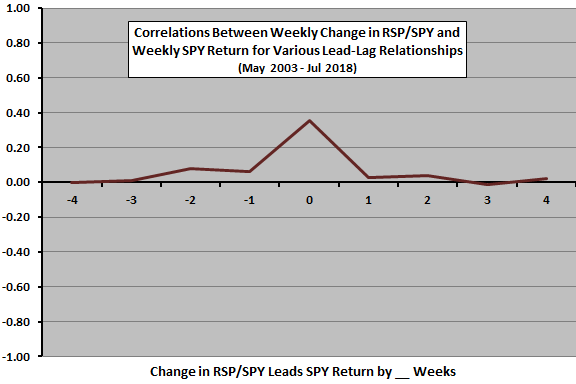
The next chart summarizes correlations for various lead-lag relationships between weekly change in RSP/SPY and weekly SPY return over the available sample period, ranging from SPY return leads change in RSP/SPY by four weeks (-4) to change in RSP/SPY leads SPY return by four weeks (4). Notable points are:
- The strongest relationship is coincident.
- Correlations for change in RSP/SPY leads SPY return are near zero, suggesting that some longer measurement interval would not work better.
In case there is some exploitable non-linearity, we examine next-week SPY return by range of weekly change in RSP/SPY.
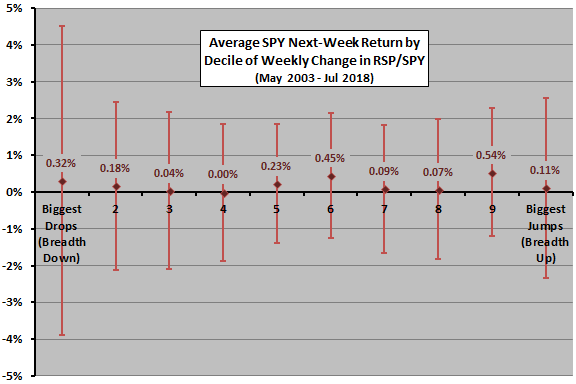
The next chart summarizes average next-week SPY returns with one standard deviation variability ranges by ranked tenth (decile) of change in RSP/SPY over the available sample period. The number of observations per decile is 79-80. The average weekly SPY return over the entire sample is 0.20%. There is no systematic relationship between average next-week return across deciles of weekly change in RSP/SPY. As observed above, there is extreme dispersion of near-term returns after the largest drops in the ratio.
What if we distinguish between bull and bear market states?
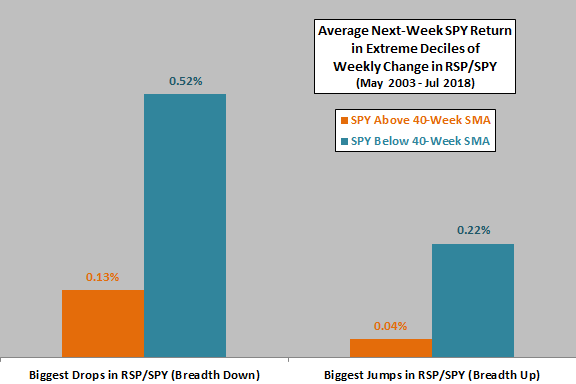
The final chart summarizes average next-week SPY returns for extreme bottom (biggest drops) and top (biggest jumps) deciles of changes in RSP/SPY over the available sample period according to whether SPY is above (bull state) or below (bear state) its 40-week simple moving average. Of the 79 biggest drops in RSP/SPY, SPY is in a bull (bear) state for 41 (38). Of the 79 biggest jumps in RSP/SPY, SPY is in a bull (bear) state for 46 (33). Notable points are:
- Extreme drops in RSP/SPY may indicate a near-term market rebound during the bear state.
- Extreme drops and jumps in RSP/SPY are more favorable during the bear state than the bull state.
However, segmented subsamples are small for reliable inference. For example, removing the two highest weekly returns after the biggest drops in RSP/SPY during the bear state flips average next-week SPY return to negative.
In summary, evidence from an array of simple tests offers little or no support for belief that changes in RSP/SPY predict near-term SPY returns, but large drops in this ratio may predict elevated stock market volatility.
Cautions regarding findings include:
- The above analyses are in-sample. An investor operating in real time with strictly historical data may obtain different results at different times.
- The sample is very small in terms of independent measurements of the 40-week SMA (only about 20) and extremely small in terms of number of market crashes (dominated by the 2008-2009 crash).
- As noted above, extreme decile subsamples segregated by bull and bear states are small and associated findings therefore unreliable.