A reader asked whether the counter trend trade for individual stocks as described on page 384 of David Aronson’s Evidence-Based Technical Analysis: Applying the Scientific Method and Statistical Inference to Trading Signals applies also to the broad stock market. The trade comes from a “study that stocks that have declined sharply over the prior two weeks on declining volume display a systematic tendency to rise over the following week.” Since this trade utilizes two indicators, we check each indicator separately and then the combination of indicators. Using weekly prices and volumes for Standard & Poor’s Depository Receipts (SPY) as a tradable proxy for the broad U.S. stock market over the period February 1993 through July 2010 (913 weeks), we find that:
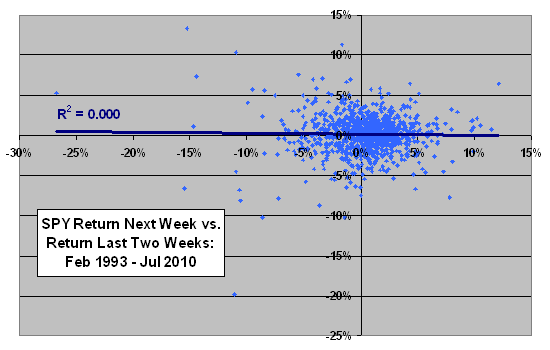
The following scatter plot relates the return on SPY next week to the return on SPY during the preceding two weeks over the entire sample period. The Pearson correlation for the relationship is -0.02, and the R-squared statistic is 0.000, indicating that past return explains nothing about future return.
In case there is a material non-linearity in the relationship, we look at quintiles of past returns.
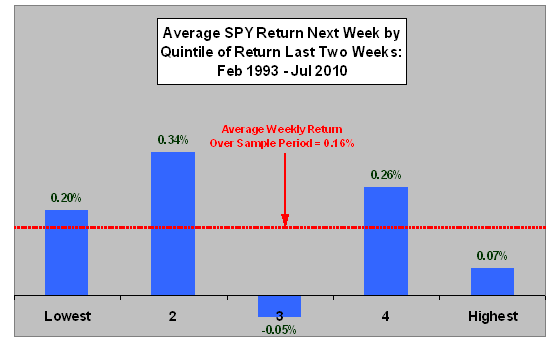
The next chart summarizes the average return on SPY next week by quintile of returns on SPY during the preceding two weeks over the entire sample period. Each quintile consists of 182 instances. The average return for all weeks in the sample is 0.16%, as shown. There is no systematic relationship between past return and future return, and the future return for the quintile of lowest past returns is unremarkable (but the standard deviation of future returns for this quintile is especially high).
Next, we look at future return versus past change in volume.
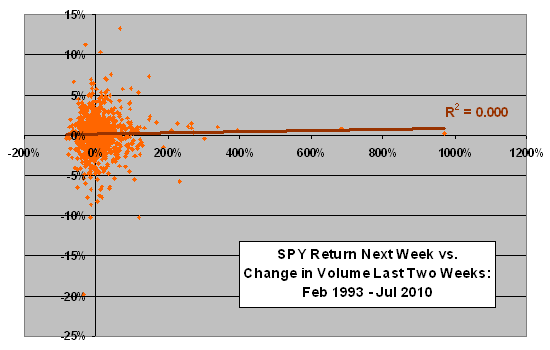
The next scatter plot relates the return on SPY next week to the change in volume for SPY during the preceding two weeks over the entire sample period. The Pearson correlation for the relationship is 0.02, and the R-squared statistic is 0.000, indicating that past change in volume explains nothing about future return.
Some of the swings in volume seem incredible.
In case there is a material non-linearity in the relationship, we look at quintiles of past changes in volume.
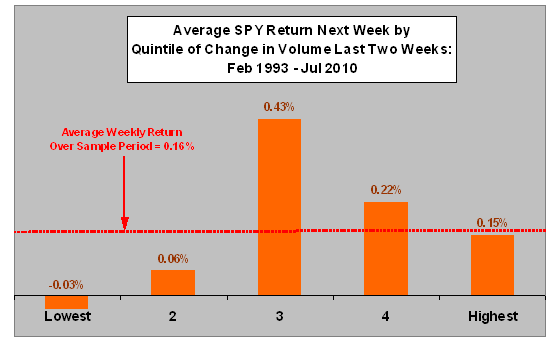
The next chart summarizes the average return on SPY next week by quintile of changes in volume for SPY during the preceding two weeks over the entire sample period. Each quintile again consists of 182 instances. The average return for all weeks in the sample is 0.16%, as shown. There is no systematic progression between past change in volume and future return, but the lowest (most negative) changes in past volume indicate relatively weak future return with an unremarkable standard deviation of returns.
The smallest absolute changes in past volume (center bar) indicate relatively strong future return.
Next, we look at two ways to combine past return and past change in volume.
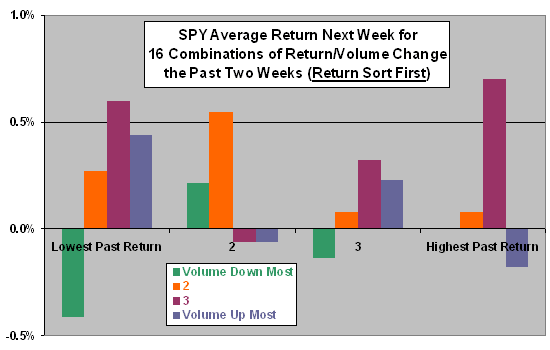
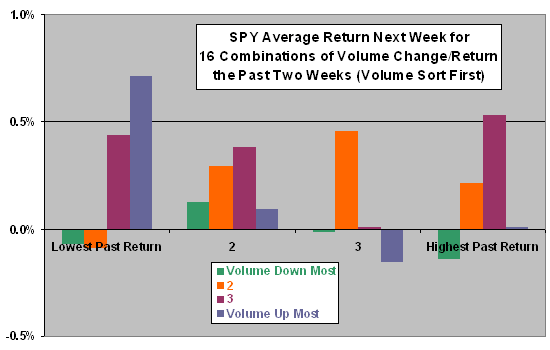
The next two charts summarize results of double-sorts on past return and past change in volume, producing 16 groups of indications (using quartiles rather than quintile based on available sample size). The first (second) chart sorts on past return (past change in volume) first. Each of the 16 groups consists of 57-58 instances.
Contrary to the cited finding for individual stocks, the group with lowest past returns and lowest changes (largest decreases) in volume generates below-average future returns for both sorts.
As noted above, the four groups within “Lowest Past Return” have especially high standard deviations of future returns (for both sorts).
Note that both charts suggest, with reservations because of small subsample size:
- The combination of low past return and volume not declining sharply over the past two weeks may indicate reversal the next week.
- The strong return found above for the smallest absolute changes in past volume appears to spread across all ranges of past returns.
In summary, evidence from simple tests does not support application of the cited short-term (last two weeks versus next week) counter trend trade to the broad U.S. stock market.
The above analysis uses a very different sample period from the original study. Also, different ways of measuring the trend in price and volume over the past two weeks may produce different results.
One reason that the broad stock market may behave differently from the average of individual stocks is widespread hedging, whereby broad market and individual stock trades mirror rather than copy. Hedge trading might suppress or even reverse in the broad market anomalies seen on average among individual stocks.