A reader asked whether the gold-gold miner stocks arbitrage-like argument in Jay Kaeppel’s February 2010 article “Don’t Give Up On Gold Stocks Just Yet” (for which his September 2004 article “Gold Stock and Gold Bullion” is a more robust antecedent) supports frequent timing of these assets. For example, if SPDR Gold Shares (GLD) and Market Vectors Gold Miners GDX) diverge over some recent interval, do they then reliably converge quickly? To check, we examine the relative price behaviors of these funds. Using weekly dividend-adjusted closes for GLD and GDX during late May 2006 (inception for GDX) through mid-May 2016, we find that:
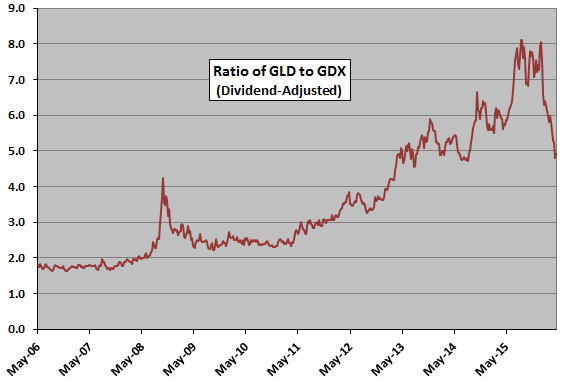
The following chart depicts the ratio of GLD to GDX over the available sample period. Over the sample period, the average weekly return for GLD (GDX) is 0.17% (0.08%), with standard deviation of weekly returns 2.62% (5.55%). The correlation of weekly returns between GLD and GDX is 0.80.
There is no evidence of a long-term average to which the ratio reliably reverts. In case there is a short-term divergence-convergence pattern, we consider a rolling historical window of 13 weeks, matching the quarterly earnings release frequency for gold miners.
Do GLD and GDX respond reliably to divergences found at this measurement interval?
To assess GLD-GDX response to divergence in a 13-week window, we:
- Calculate the average GLD-to-GDX ratio over the past 13 weeks.
- Subtract this average from the last value of the ratio in the series.
- Divide this difference by the standard deviation of the GLD-to-GDX ratio over the past 13 weeks, generating divergence in number of standard deviations.
- Relate next-week returns for GLD and GDX to weekly divergence. A positive (negative) divergence implies that GLD (GDX) is relatively overvalued.
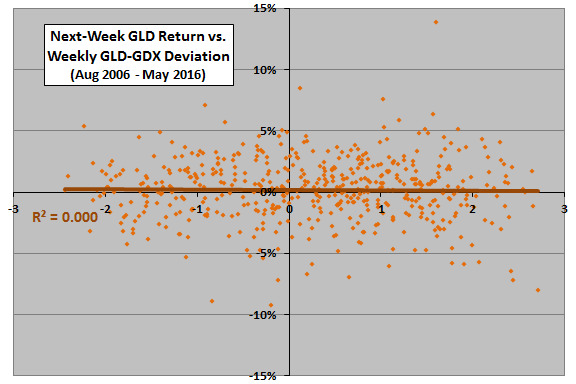
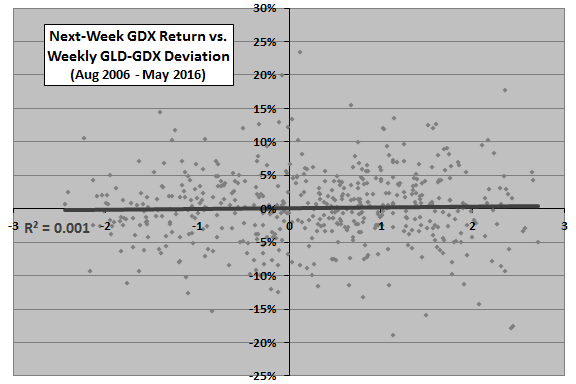
The following two scatter plots relate next-week GLD return (upper plot) and next-week GDX return (lower plot) to GLD-GDX divergence as specified. If there is reliable convergence after divergence, than the best-fit line in the upper (lower) plot should slope noticeably downward (upward). In other words, if GLD-GDX divergence is high, convergence implies that GLD must be relatively weak and GDX relatively strong. If GLD-GDX divergence is low, convergence implies that GLD must be relatively strong and GDX relatively weak.
R-squared statistics are 0.000 for GLD returns and 0.001 for GDX returns, indicating no linear relationships between next-week returns and the weekly divergence measurement.
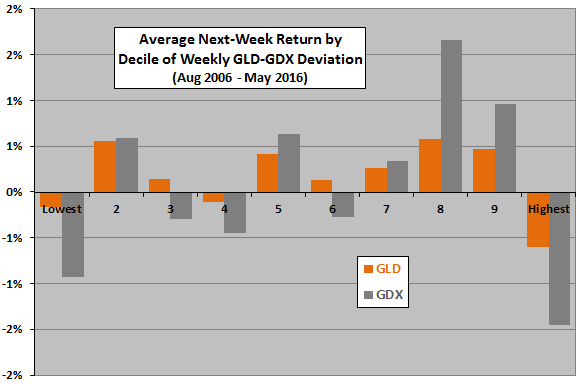
Might there be exploitable non-linear GLD and GDX reactions to weekly divergence?
The next chart summarizes average next-week GLD and GDX returns by ranked tenth (decile) of weekly GLD-to-GDX ratio divergence. Results confirm that there is no systematic future return reaction to the ratio for either GLD or GDX, and that GDX is more volatile than GLD.
Despite lack of in-sample supporting evidence, we try a simple GLD-GDX pair trading strategy based on the GLD-to-GDX ratio.
Trading rules are:
- When weekly GLD-to-GDX ratio crosses X standard deviations above (below) its 13-week average, take a $10,000 long GDX (GLD) position and a -$10,000 short GLD (GDX) position, with X = 0, 1 or 2. Otherwise hold cash.
- When positions do not change from week to week, reset long and short sides to $10,000 and -$10,000.
- Cash earns the yield on U.S. Treasury bills.
- Since position changes involve two or four trades, assume trading frictions are 0.2% per change. Ignore frictions for resetting position sizes when positions do not change.
- Ignore any broker charges and collateral requirements beyond the long position for shorting.
- Ignore tax implications of trading.
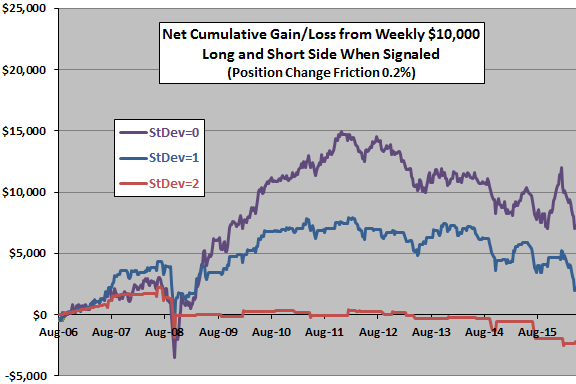
The final chart tracks net cumulative gains/losses for the three strategy variations (StDev=0, StDev=1 and StDev=2) over the available sample period. The numbers of position changes for StDev=0, StDev=1 and StDev=2 are 101, 165 and 53, respectively. Notable points are:
- StDev=0, which is never in cash, mostly performs best.
- All variations perform poorly during the 2008 equity market crash. In other words, the pair trading approach may preclude gold’s safe haven property.
- All variations act differently when gold is rising and falling, performing poorly after the gold price peak in August 2011.
Breakeven position change trading frictions for StDev=0, StDev=1 and StDev=2 are 0.57%, 0.27% and 0.01%, respectively.
In summary, evidence from simple tests on a recent sample does not support belief in the effectiveness of GLD-GDX pair trading based on the GLD-to-GDX ratio.
Cautions regarding findings include:
- Sample size is very small in terms of number of gold regimes.
- Other ways of measuring GLD-GDX divergence may work better, but optimizing would would impound data snooping bias (luck) into the best alternatives, thereby overestimating out-of-sample performance.
See also “GDX vs. GLD”, “Gold vs. Gold Miners” and “Gold Futures vs. Gold Miner Stocks”.