A reader asked: “Jason Kelly from the Kelly Newsletter posted this remark in January 2008: ‘A good way to judge trading opportunities on indexes is by watching their MACD and RSI scores. Both together, along with the price chart, give good indications as to whether the odds favor rising or falling from here.’ Is this true?” Here is a simple test of the 14-day Relative Strength Index (RSI), as calculated by the template at StockCharts.com, on a tradable proxy for the S&P 500 index. Note that this indicator measures the strength of price for an asset relative to its own recent past, not relative to other assets. We use the conventional interpretation that values of RSI below 30 (above 70) indicate oversold (overbought) conditions ripe for reversion. Using daily dividend-adjusted closing prices for the S&P Depository Receipts Trust (SPY) from 1/29/93 (the earliest available) through 2/29/08, we find that:
We apply the RSI calculation and thresholds as follows:
- Calculate RSI for each day in the sample.
- The first time there is an oversold indication (RSI < 30), buy SPY at the close.
- The first time there is subsequently an overbought indication (RSI > 70), sell SPY at the close.
- Repeat the previous two steps across the entire sample.
- Whenever out of SPY, assume a daily return on cash equal to the contemporaneous 90-day Treasury bill (T-bill) yield.
- Ignore trading fees/frictions (since there are on average only a few transactions per year).
This approach generates 68 RSI-triggered transactions (34 round trips) over the entire sample period, an average of about two round trips per year. Of the 3,799 trading days in the sample, these transactions put the portfolio in SPY 1,117 days (29%) and out of SPY 2,682 days (71%). The 34 round trips produce 27 gains (with the largest 13.3% in early 2000) and only seven losses (with the largest -13.9% in mid-2002). The average gain for all 34 round-trip trades is 2.5%.
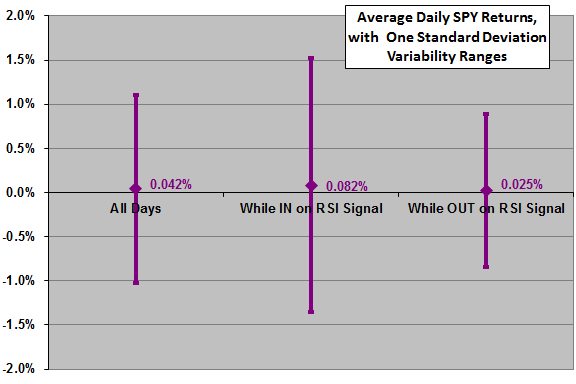
The following chart summarizes the average daily SPY returns for all days in the sample, days when in the market on RSI signals and days when out of the market on RSI signals. It shows that daily SPY returns tend to be above normal between RSI oversold and overbought signals and below normal between RSI overbought and oversold signals. It also shows that daily return volatility tends to be relatively high when in the market.
Do these results make the RSI trading strategy a market-beater?
The next chart plots the cumulative value of $1 initial investments made at the close on 1/29/93 in three strategies:
- Buy and hold SPY
- Trade in and out of SPY on RSI oversold-overbought (30-70) indications, with no return while out of stocks
- Trade in and out of SPY on RSI oversold-overbought (30-70) indications, with return on cash while out of stocks equal to the contemporaneous daily T-bill yield
The chart shows that the RSI strategies underperform buy-and-hold over the sample because: (1) they are often out of stocks; and, (2) even the low return on SPY while the RSI strategies are out of stocks beats the T-bill yield. Visual inspection suggests that the RSI strategies tend to underperform (outperform) buy-and-hold during bull (bear) market phases, lending them some appeal on an annual risk-adjusted basis. Results are sensitive to the start date of the analysis.
Are there better ways to exploit RSI signals?

Some ideas for exploiting RSI signaling are:
Apply leverage on buy signals to exploit the abnormally high average returns during such intervals. However, leverage is not free, and the relatively high daily volatility during these intervals may make leverage painful. Also, unleveraged buy-and-hold may not be the appropriate benchmark for leveraged strategies.
Combine RSI on SPY with RSI on other assets/asset classes to generate a better return than the T-bill yield when out of SPY. Different assets/asset classes may be sufficiently “out-of-synch” with the broad U.S. stock market to support this approach, but capital may not be available for the portfolio to respond crisply to all RSI signals as generated.
Reduce the number of days out of stocks by loosening RSI signal thresholds (40-80 rather than 30-70). The 40-80 alternate thresholds keep the portfolio in stocks about two-thirds of all trading days, but the average daily return while in the market (0.048%) is only a little greater than the average daily return for the entire sample (0.042%). The resulting cumulative returns still fall short of buy-and-hold.
In summary, a broad index trading strategy based solely on RSI oversold/overbought signals probably underperforms buy-and-hold over long periods, but RSI signals might be useful within more complex strategies.