Does asset allocation based on both trend following via a simple moving average (SMA) and return momentum work well? In the July 2015 update of their paper entitled “The Trend is Our Friend: Risk Parity, Momentum and Trend Following in Global Asset Allocation”, Andrew Clare, James Seaton, Peter Smith and Stephen Thomas examine the effectiveness of trend following based on SMAs and momentum screens in forming portfolios across and within asset classes. They consider five asset classes: developed equity markets (24 component country indexes); emerging equity markets (16 component country indexes); bonds (19 component country indexes); commodities (23 component commodity indexes); and, real estate (13 country REIT indexes). They compare equal weight and risk parity (proportional to inverse 12-month volatility) strategic allocations. They define trend following as buying (selling) an asset when its price moves above (below) a moving average of 6, 8, 10 or 12 months. They consider both simple momentum (12-month lagged total return) and volatility-adjusted momentum (dividing by standard deviation of monthly returns over the same 12 months) for momentum screens. They ignore trading frictions, exclude shorting and assume monthly trend/momentum calculations and associated trade executions are coincident. Using monthly total returns in U.S. dollars for the five broad value-weighted asset class indexes and for the 95 components of these indexes during January 1993 through March 2015, along with contemporaneous 3-month Treasury bill yields as the return on cash, they find that:
- Risk parity applied monthly:
- Across five asset class indexes at the index level outperforms equal weight over the sample period, with about the same gross annualized return (6.6%) and substantially higher gross Sharpe ratio (0.67 versus 0.33), largely due to the strong contribution of bonds.
- To individual asset indexes within asset classes adds little to class performance.
- Trend following applied monthly:
- Across five asset class indexes at the index level substantially improves an equal weight allocation via crash protection. For the 10-month SMA, trend following boosts gross annualized return from 6.6% to 8.0%, boosts gross annual Sharpe ratio from 0.33 to 0.79 and lowers maximum drawdown from -46.6% to -11.6%.
- To individual assets within asset classes (on an equally weighted basis rather than value-weighted as in the class indexes) substantially boosts gross annualized return and gross annual Sharpe ratio and lowers maximum drawdown for each class except bonds.
- To individual assets within asset classes (equally weighted), which are then combined into an equally weighted, monthly rebalanced portfolio of the five asset classes further boosts performance. For the 10-month SMA, gross annualized return is 9.1% and gross annual Sharpe is 0.89
- Combining risk parity and trend following across five asset class indexes is unexceptional with respect to gross annualized return (6.9%), but exceptional for gross annual Sharpe ratio (1.06) and maximum drawdown (-4.9%).
- Relative momentum applied monthly to screen individual assets within asset classes on an equally weighted basis:
- Generally offers improvements in class performance, inferior to those from trend following, with no protection against large maximum drawdowns
- Shows little difference for selecting the top half or top quarter of assets.
- When combined into an equally weighted, monthly rebalanced portfolio of the five asset classes generates gross annualized return 10.1%, gross annual Sharpe ratio 0.57 and maximum drawdown -43.8%.
- Volatility-adjusted momentum screens yields roughly the same gross outcomes as simple momentum screens.
- Compared to pure trend following portfolios, combining momentum and trend following within asset classes offers some boost to gross class returns but little or no improvement to gross class Sharpe ratios. This result suggests that adding momentum to trend following may be a substitute for leverage.
- A completely tactical asset allocation strategy that each month ranks all 95 asset indexes regardless of class by volatility-weighted momentum and:
- Allocates funds equally to the top 20 indexes generates a gross annualized return of 13.8%, with gross annual Sharpe ratio 0.85 and maximum annual drawdown -32.3%.
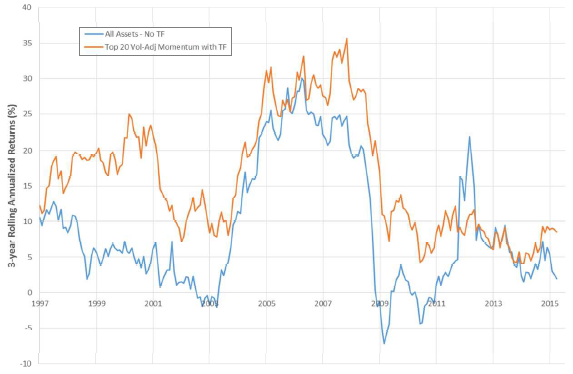
- Allocates funds equally to the top 20 indexes or to cash for those indexes below their 10-month SMA generates a gross annualized return of 14.5%, with gross annual Sharpe ratio 0.99 and maximum annual drawdown -18.3% (see the chart below). The four commonly considered risk factors (market, size, book-to-market and momentum) explain only about one third of this performance.
- “…most striking is the sharply improved performance of the trend following and combined momentum and trend following strategies with their low maximum drawdown and mild positive skewness when compared to the sharply negatively skewed momentum returns.”
The following chart, taken from the paper, compares rolling three-year gross annualized returns for: (1) an equally weighted portfolio of all 95 assets with no exclusions based on trend following; and, (2) a completely tactical asset allocation strategy that each month ranks all 95 asset indexes by volatility-weighted momentum and allocates funds equally to the top 20 indexes or to cash for those indexes below their 10-month SMA. The tactical allocation strategy nearly always outperforms the equal weight strategy, with no losing three-year intervals and only one interval with gross annualized return below 5%. Intervals of greatest outperformance for the tactical strategy derive from protection from crashes in one or more asset classes.
In summary, evidence indicates that combining SMA-based trend following with momentum screens boosts raw and risk-adjusted gross performance while reducing drawdowns both across and within asset classes.
Cautions regarding findings include:
- Portfolio return calculations are gross, not net. Including reasonable index trading frictions would reduce reported returns. For tests granularly involving all 95 asset indexes and a relatively large number of portfolio positions, trading frictions would be elevated due to both increased turnover and reduced position sizes, such that findings based on net outcomes may be different. There would be a trade-off between incremental diversification and incremental trading frictions.
- The study employs indexes rather than tradable assets, tending to overstate the returns an investor would experience after bearing the trading frictions and management fees associated with index-tracking funds. These costs would likely vary over time and across asset classes.
- Considering a large number of asset selection and portfolio formation rules introduces data snooping bias. The best-performing portfolios thus overstate expectations for future performance. Borrowing the best rules from prior research may amplify snooping bias.
- In the allocation alternatives involving all 95 asset indexes, the assumption that trade execution can be coincident with signal calculations may be problematic.
- The sample period is not long in terms of number of independent SMA calculation and 12-month momentum ranking intervals.
See “Asset Class Momentum Strategy” for research with some parallels.
Note that treating cash as an asset rather than a safe haven in a relative momentum strategy is a simple alternative to using trend following for crash protection (per “Momentum Strategy”).