Does the degree to which a stock tracks the market and its industry predict its future performance. In their July 2010 paper entitled “R2: Does It Matter for Firm Valuation?”, John Stowe and Xuejing Xing investigate how the coefficient of determination (R-squared statistic) relating individual stock returns to market/industry returns affects the stock’s market valuation and future returns. They calculate R-squared for a stock’s returns using weekly data by firm fiscal year (and apply a logarithmic transformation). Using weekly stock returns and associated firm fundamentals/characteristics for a broad sample of U.S. stocks and weekly market and industry returns (excluding financials and utilities) over the period 1970-2007, they find that:
- Stocks with higher R-squared relative to market and industry tend to have higher valuations based on accounting fundamentals (Tobin’s q). The average Tobin’s q of the 25% firms with the highest R-squared is 0.25 higher than that of the 25% firms with the lowest R-squared.
- On average, firms with stocks exhibiting high R-squared are more profitable, larger, older and more liquid than those with stocks exhibiting low R-squared. They also use less debt, have higher institutional ownership and invest more.
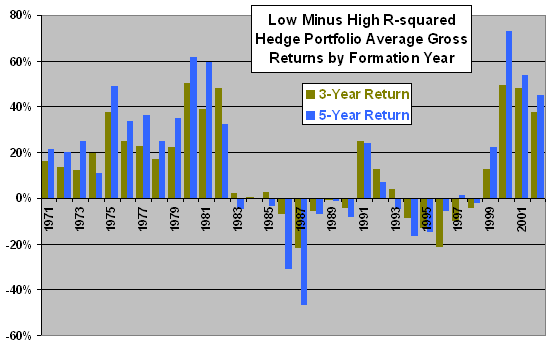
- On average, stocks exhibiting high R-squared underperform in the long run. 22 of 32 equally weighted hedge portfolios constructed annually during 1971-2002 that are long (short) the fourth of stocks with the lowest (highest) R-squared generate positive returns over the next three years (see the chart below).
- Stocks with low R-squared on average outperform those with high R-squared in seven of the eight years during 1971-2002 for which the stock market has a negative return. During the worst six market years, stocks with low R-squared always beat those with high R-squared.
The following chart, constructed from data in the paper, shows average 3-year and 5-year future gross returns by formation year for equally weighted hedge portfolios that are long (short) the fourth of stocks with the lowest (highest) R-squared statistics based on weekly returns relative to market and industry over the prior year. Results suggest that stocks with high past R-squared statistics are overvalued relative to those with low past R-squared statistics and that misvaluations tend to resolve over several years. However, there can be long periods during which this hedge does not perform well. There is a hint that bear markets trigger resolution of misvaluations.
Results do not include costs of portfolio formation and liquidation.

The sample period seems short with respect to future return horizons and, if relevant, number of bull and bear markets.
In summary, investors may be able to identify stocks inclined to outperform and underperform over the long term based on the degree to which their short-term returns track market and industry returns.