A reader suggested reviewing the detailed track record of SweetSpot Investments LLC, consisting of 29 closed trades over the past 12 years. The basic SweetSpot strategy posits market-beating three-year reversion of the three least popular “sectors” out of 100 formed from 500 non-diversified mutual funds and exchange-traded funds (ETF). Popularity is a function of fund assets and prior-year fund flows and returns. From a practical perspective, this strategy results in a steady-state portfolio of nine “sector” funds, each year selling the three oldest holdings and adding three new ones. Since 2009, the strategy includes as a hedge a short position in a market index fund or a position in an inverse market index fund “whenever the market’s intermediate-term trend falls below its long term trend.” The detailed track record includes no trades since that change in strategy. Using results from 29 SweetSpot trades from the end of 1998 through the beginning of 2011, we find that:
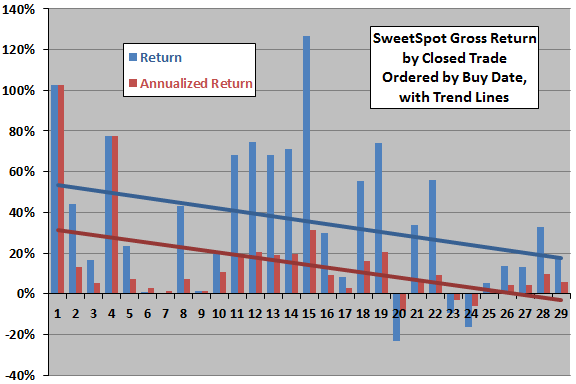
The following chart summarizes the total and annualized gross returns for the 29 SweetSpot trades, ordered by opening date, along with best-fit linear trend lines. The number of open positions varies from three to ten, with holding periods ranging from one year to five years (nine trades have holding periods other than three years). Because most trade holding periods are longer than one year, annualized returns are generally much smaller than total trade returns. Average total (annualized) gross trade return is 35.5% (14.1%).
Both trend lines slope downward, indicating declining profitability over time. The average annualized gross return for the first 15 (last 14) trades is 22.5% (5.1%). These results suggest the possibility of a lucky start, wherein an initial spurt of strong performance encourages fund launch but depends to a material degree on good luck.
How do these returns compare to broad stock market performance?

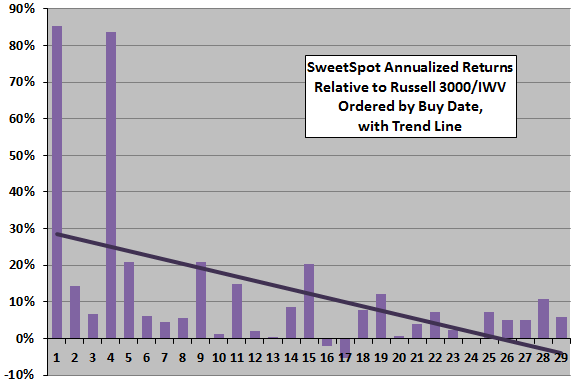
The next chart summarizes annualized gross returns for the 29 SweetSpot trades relative to contemporaneous iShares Russell 3000 Index (IWV) annualized returns (or Russell 3000 Index annualized returns for trades initiated before May 2000), ordered by opening date, along with a best-fit linear trend line. SweetSpot beats IWV in 26 of 29 years, but the downward slope of the trend line indicates diminishing outperformance over time. The trend line still slopes downward after excluding the exceptional first and fourth trades.
Does applying a simplified strategy to the annual loser among nine SPDR sectors support a strategy of three-year reversion outperformance?

As a rough, independent assessment of the basic (pre-2009) SweetSpot strategy, we examine three-year future reversion of the annual loser among the following nine sector ETFs, and the S&P 500 SPDR (SPY) as a benchmark, over the period December 1998 through December 2010 (12 years):
Materials Select Sector SPDR (XLB)
Energy Select Sector SPDR (XLE)
Financial Select Sector SPDR (XLF)
Industrial Select Sector SPDR (XLI)
Technology Select Sector SPDR (XLK)
Consumer Staples Select Sector SPDR (XLP)
Utilities Select Sector SPDR (XLU)
Health Care Select Sector SPDR (XLV)
Consumer Discretionary Select SPDR (XLY)
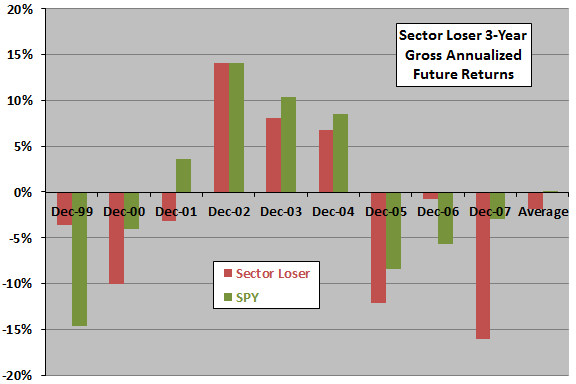
Specifically, at the end of each year during 1999-2007, we buy the sector ETF with the worst prior-year return and calculate gross annualized returns for a three-year holding interval. For comparison, we calculate contemporaneous three-year gross annualized future returns for SPY. The following chart summarizes results, showing that the losing sector underperforms SPY on average and for six of nine annual trades. Findings do not support belief that three-year reversion of sector losers beats the market.
Based on this simple test on a small sample, it seems that equity market segmentation finer than nine sectors and/or other measures of fund unpopularity are important to the SweetSpot strategy.

In summary, evidence from available trade data indicates that the SweetSpot strategy of exploiting three-year reversion of “unloved” market niches may reliably beat the broad equity market, but overall results may include a lucky start.
Cautions regarding findings include:
- Analyses accept trade data as reported by SweetSpot Investments LLC.
- The sample period is extremely short in terms of number of independent three-year reversion intervals (only four). It is possible that the reversion interval varies over long periods and three years happens to fit some or all of the sample period.
- As noted above, about one-third of SweetSpot trade holding periods do not conform to the basic three-year reversion strategy.
- The above returns are gross. SweetSpot currently charges a management fee of 1.0% per year. Trading of mutual funds may involve surcharges, and trading of ETFs involves bid-ask spreads and transaction fees. Infrequent trading mitigates concerns about trading frictions.
- As noted above, the SweetSpot strategy changed after the available sample to include a hedge based on market conditions (perhaps when the 50-day simple moving average of a broad market index falls below its 200-day simple moving average), so performance statistics since 2009 may be quite different.