A subscriber suggested testing of the Guardian Indicator, “a proprietary new market-strength indicator designed to enhance risk-adjusted investment returns by identifying long-term directional changes in the stock market.” This indicator tabulates Guard Score (GS) “votes” by U.S. equity sectors to predict the trend of the overall U.S. stock market. Per the paper “Introducing Guardian Indicator: Market Timing Based on Momentum and Volatility”, flagged by the subscriber, GS is the greater of two contributing indicators:
- Price momentum indicator (PI), the ratio of the 50-day simple moving average (SMA) to the 200-day SMA of asset/index level.
- Volatility regime indicator (VI), the ratio of the 1250-day SMA to the 250-day SMA of downside deviation, calculated as the square root of the sum of squared negative daily returns over the past 90 trading days divided by 90.
If GS is greater than one, the trend is bullish. The paper applies GS to time the S&P 500 Index during 1957-2014 (apparently without dividends). Here we replicate the GS series for the S&P 500 Index (excluding dividends) and use it to time the index. In calculating returns, however, we account for S&P 500 dividends by each month allocating the annual dividend yield from Robert Shiller’s data to the days of that month (dividing by 252). We assume cash earns the 3-month U.S. Treasury bill (T-bill) yield. We invest in the S&P 500 Index (T-bills) when prior-day GS for the index is greater than (less than or equal to) one. We focus on compound annual growth rate (CAGR) and maximum drawdown (MaxDD) as performance measures. We use total return from buying and holding the S&P 500 Index (B&H) as a benchmark. Using daily S&P 500 Index level and monthly S&P 500 dividend yield and T-bill yield during January 1950 through December 2015 (allowing first calculation of VI in May 1955), we find that:
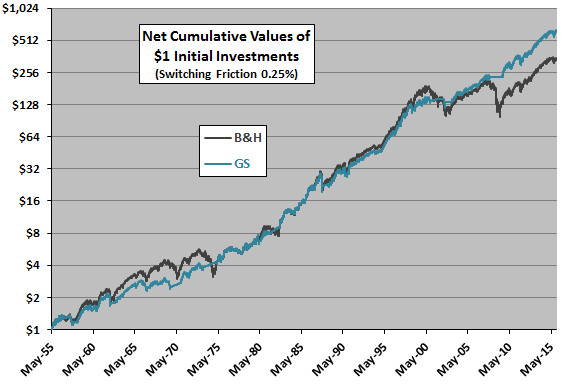
The following chart tracks B&H versus the specified GS timing strategy on a logarithmic scale over the available sample period. Assumptions are:
- It is possible to accurately estimate GS just before the close so that we can implement new signals at the same close.
- Switching friction is a constant 0.25% over the sample period.
- Ignore tax implications of trading.
Terminal outperformance of the GS strategy comes mostly from avoiding the 2008 market crash. There are extended subperiods during which the GS strategy matches or underperforms B&H.
Average daily return for the GS strategy (B&H) is 0.045% (0.043%) over the entire sample period, with daily Sharpe ratio 0.034 (0.025).
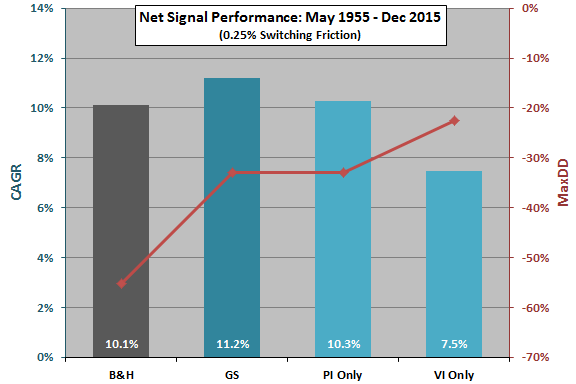
For another perspective, we look at CAGRs and MaxDDs for the GS strategy and for comparable strategies based on its component signals.
The next chart summarizes net CAGRs and MaxDDs for B&H, the GS strategy, a strategy that holds stocks (T-bills) when prior-day PI is greater than one (PI Only) and a strategy that holds stocks (T-bills) when prior-day VI is greater than one (VI Only). It shows that:
- All three timing strategies substantially suppress MaxDD.
- Combining PI and VI in the GS strategy enhances CAGR (but not MaxDD).
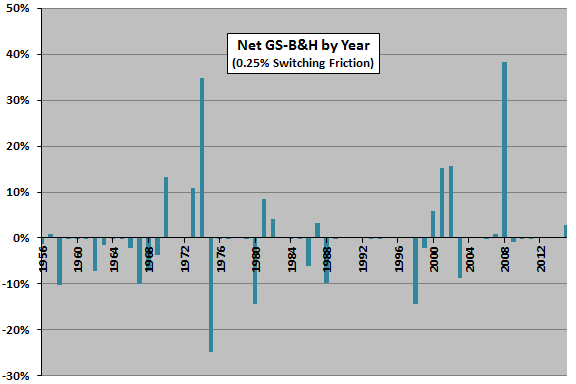
For additional insight, we look at GS strategy outperformance of B&H by calendar year.
The next chart shows GS strategy return minus B&H return by year over the available sample period. Three years stand out: 1974 and 2008 (outperformance) and 1975 (underperformance). There are nine other years of material outperformance (including the 2000-2002 bear market) and 13 other years of material underperformance. A possible interpretation is that the GS strategy works based on two positive outliers. The chart confirms that the GS strategy underperforms for extended subperiods.
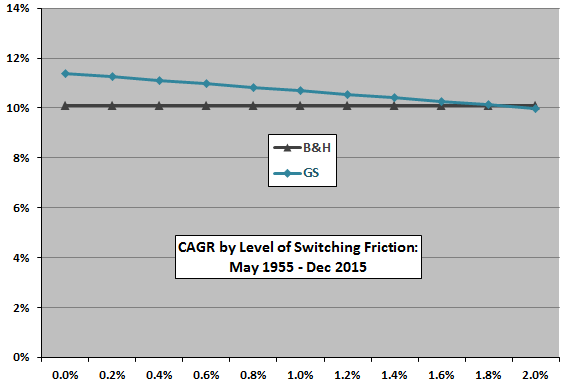
Next, we look at sensitivity of GS strategy outcome to assumed level of switching frictions.
The next chart shows how GS strategy CAGR declines as the level of switching frictions increases from 0.0% to 2.0% (constant over the sample period). The GS strategy outperforms B&H for switching frictions below about 1.6%. Actual trading frictions vary considerably over the sample period (see “Trading Frictions Over the Long Run”).
The GS strategy is relatively insensitive to level of switching frictions because it switches only 36 times during the sample period, on average about once every two years. For comparison PI Only (VI Only) switches 64 (27) times.
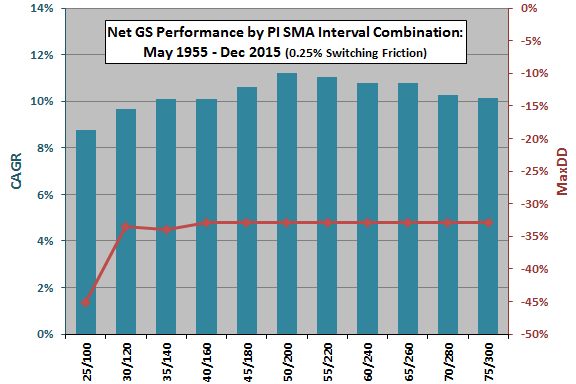
Finally, we investigate whether the lengths of the SMA intervals used to calculate PI might impound snooping bias.
The final chart summarizes net CAGRs and MaxDDs for 11 different combinations of SMA interval lengths used to calculate PI, ranging from 25 trading days/100 trading days (25/100) to 75/300. As described above, the baseline intervals are 50/200.
Except for the shortest calculation intervals, MaxDD is insensitive to interval lengths. Based on CAGR, 50/200 is optimal. Potential explanations for optimality are:
- 50/200 has some true meaning with respect to investor/market behaviors.
- 50/200 is lucky, discovered via snooping, and results based on this combination therefore biased.
Similar sensitivity tests could be applied to the downside deviation interval (90 days) and the SMA measurement intervals (1250 and 250 days) used for calculating VI.
In summary, evidence indicates that the Guardian Score may have some value for timing the U.S. equities market via a few bursts of market outperformance (crash avoidance), but with some extended periods of market underperformance.
The outperformance of the GS timing strategy may not be convincing after accounting for the risk of snooping bias.
Cautions regarding findings include:
- Using indexes to estimate returns ignores the costs of maintaining a liquid fund. These costs would likely vary over time and reduce reported returns.
- The approaches to modeling S&P 500 dividends and switching frictions are crude. Infrequent trading of the tested strategy mitigates dividend modeling concern. As noted, switching frictions vary considerably over time, recently falling to historically low levels.
- As discussed, there may be snooping bias in the lengths of the SMA intervals used to calculate PI and VI and in the length of the interval used to calculate downside deviation.
- There may be snooping bias in the number of Guardian Indicator equity sector “up-votes” specified to indicate a broad market uptrend (not tested above).