
In 2007, a reader inquired about the usefulness of James Altucher’s QQQQ Crash Trade Trigger. As stated by James Altucher: “The basic idea is that if the QQQQs, the volatile ETF representing the Nasdaq 100 index, make a sharp move down, then mean reversion will eventually kick in and bring the index back up. In other words, whenever people are panicking, that’s the time to get in. The move is not always a huge move but it’s been reliable.” Using QQQQ daily open, low and closing prices for 3/10/99 (the earliest available) through 8/19/09, we find that:
To test the QQQQ Crash Trade Trigger, we apply the rules and guidance as stated in the referenced article, as follows:
- Buy [at the following open] when QQQQ closes 1.5 standard deviations below the 10-day moving average of the daily low price.
- Sell [at the close] either after 20 [trading] days or on any earlier day that QQQQ closes higher than the entry price.
- “The way I would play this now is to leg into it. Take a partial position at the entry price and then average down if the trade lasts for more than one day. If the QQQQs close higher than the entry on day one then so be it. Take the profit and go on to the next trade. If the QQQQs close lower, then start to take a more full position and get a better average price than the system price.” We implement this guidance mechanically by buying at the open on each day that a trigger remains in force.
In all the analyses that follow, we assume round-trip trading friction of 0.2%. Actual trading friction would depend on QQQQ liquidity (bid-ask spread), specific broker transaction fees and account size.
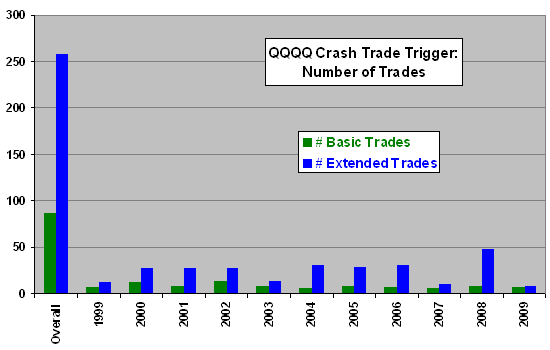
The following chart summarizes the total number of basic trades (initial entries) and extended trades (initial entries plus daily “average down” trades until the initial entries close) over the entire sample period and by calendar year. The average number of basic (extended) trades per year is about eight (25). Only three of the 86 basic trades reach the 20-day limit on duration.
How profitable are the trades?
The next chart summarizes average returns for the basic and extended trades over the entire sample period and by calendar year. Over the entire sample period, the average return for the basic (extended) trades is 1.2% (0.8%). In general, the QQQQ Crash Trade Trigger is fairly profitable during 1999-2002, but not during 2003-2009.
Why might profitability have degraded starting in 2003?
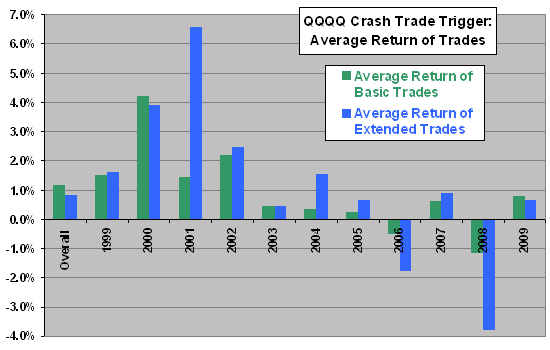
The referenced article states: “I’ve been writing about the QQQQ Crash system since early 2003.” Since beginning of 2003, the average return of basic (extended) trades is 0.38% (-0.90%). The basic trades remain profitable as long as round-trip trading friction is below 0.58%. The extended trades are unprofitable even if trading friction is zero. The poor performance of the trigger since 2003 relative to its pre-2003 performance may be due to:
- Data mining bias in the pre-2003 analysis that discovered the trade trigger.
- Market adaptation to the trigger after publication.
Note that managing capital allocation to such strategies is problematic. The above analysis assumes that the trader always has cash (or credit) available to trade QQQQ Crash Trade Triggers when they unpredictably occur. The extended (average down) trading is especially problematic since the trader generally must: (1) trade in small increments, elevating trading friction as a percentage of trade size; and, (2) hold most of available capital in reserve, greatly limiting return on total capital.
In summary, the QQQQ Crash Trade Trigger has not worked very well since James Altucher began writing about it in 2003, perhaps due to data snooping bias in the pre-publication analysis.
Frequently Asked Questions
What is the QQQQ Crash Trade Trigger?
The QQQQ Crash Trade Trigger is a mean-reversion trading rule, popularized by James Altucher, that buys the QQQQ (the ETF tracking the Nasdaq 100 index) after a sharp decline. The premise is that when people panic and the ETF falls sharply, it tends to rebound. A buy signal occurs when QQQQ closes 1.5 standard deviations below the 10-day moving average of its daily low price.
Does the QQQQ Crash Trade Trigger actually work?
The QQQQ Crash Trade Trigger worked fairly well during 1999-2002 but has not worked well since 2003. Over the full sample (March 1999 to August 2009, 86 basic trades), the average basic trade returned 1.2% after 0.2% round-trip friction. Since the start of 2003, the average basic trade returned only 0.38%, and extended (average-down) trades lost 0.90% on average.
How is the QQQQ Crash Trade Trigger tested and what are its entry and exit rules?
The QQQQ Crash Trade Trigger was tested using daily open, low and close prices for QQQQ from 3/10/99 through 8/19/09. The rule buys at the next open after QQQQ closes 1.5 standard deviations below the 10-day moving average of daily lows. It sells at the close after 20 trading days, or earlier on any day QQQQ closes above the entry price, with 0.2% round-trip trading friction assumed. Extended trades also average down by buying at the open on each day a trigger remains in force.
Why did the QQQQ Crash Trade Trigger perform better before 2003 than after, and is this a sign of data mining?
The QQQQ Crash Trade Trigger's weaker performance since 2003 may reflect data mining bias in the pre-2003 analysis that discovered it, or market adaptation after James Altucher began publishing about it in early 2003. The article does not determine which explanation is correct. Basic trades since 2003 remain profitable only if round-trip friction stays below 0.58%, while extended trades are unprofitable even with zero friction.
What are the practical limitations and risks of trading the QQQQ Crash Trade Trigger?
The QQQQ Crash Trade Trigger is hard to implement because signals occur unpredictably, so a trader must always have cash or credit available. Extended (average-down) trading is especially problematic, since it requires trading in small increments that raise friction as a percentage of trade size and holding most capital in reserve, which greatly limits return on total capital. Results also depend on actual trading friction, which varies with QQQQ liquidity, broker fees and account size, and the analysis assumed 0.2% round-trip.