A subscriber requested tests exploring whether a recent death cross for the Dow Jones Industrial Average (DJIA) portends an index crash. To investigate, we consider two ways of evaluating DJIA performance after death crosses and conversely defined golden crosses:
- Behavior of the index during the 126 trading days (six months) after death and golden crosses.
- Behavior of the index between converse crosses (death cross-to-golden cross, and golden cross-to-death cross).
We focus on distributions of average returns and maximum drawdowns (MaxDD) during specified periods. We also check robustness by repeating DJIA tests on the S&P 500 Index. Using daily DJIA closes since October 1928 and daily S&P 500 Index closes since January 1950, both through May 2017, we find that:
There are 58 death crosses and 58 golden crosses in the DJIA sample, less than one per year of each kind.
First we look at DJIA behavior during the six months after crossing signals.
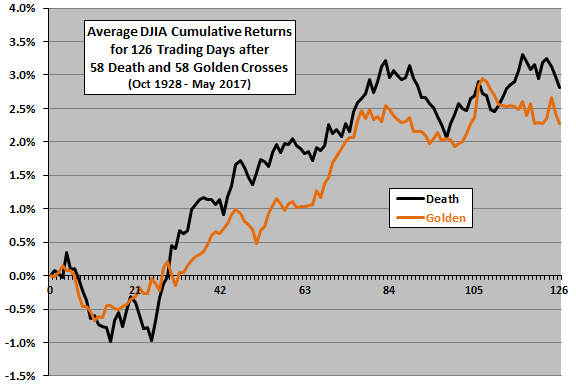
The following chart shows average cumulative return profiles for DJIA during (1) the 126 trading days after the 58 death crosses in the sample and (2) the 126 trading days after the 56 golden crosses in the sample. Differences between the two profiles are not dramatic. The index on average is a little weaker after death crosses in the short term, but a little stronger after about a month and a half. Given the variability of observations, these differences may be just noise.
A few measurement intervals overlap because signals are less than six month apart.
For another perspective, we look at distributions of returns at the end of 126 trading days after death and golden crosses.
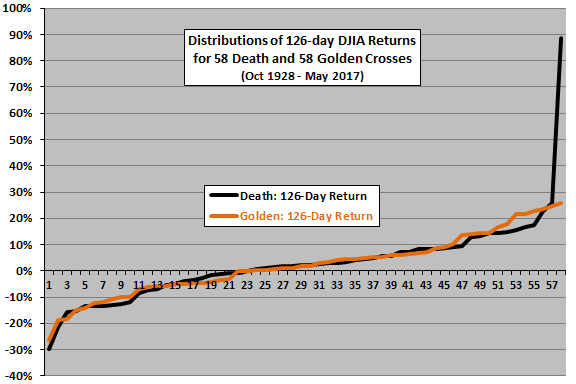
The next chart shows the distributions of 126-day terminal returns for DJIA after 58 death crosses and 58 golden crosses over the sample period. Results confirm that DJIA behaviors during the six months after death and golden crosses are very similar, except for a very large positive return after one death cross (March 1933). A few statistics are:
- After 126 trading days, terminal returns are positive 55% of the time after death crosses and 60% of the time after golden crosses.
- For positive (negative) outcomes, the average return is +11.5% (-7.9%) after death crosses and +9.5% (-8.8%) for golden crosses.
- Average (median) terminal returns are 2.8% (2.2%) after death crosses and 2.3% (1.8%) after golden crosses. Standard deviations of terminal returns are 15.8% after death crosses and 11.6% after golden crosses.
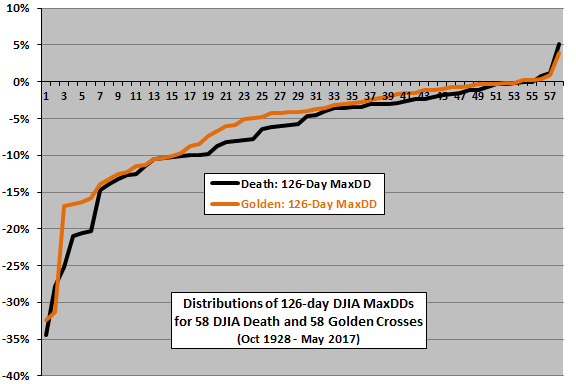
For yet another perspective, we look at the distributions of MaxDDs for DJIA during the 126 trading days after death and golden crosses.
The next chart shows the distributions of DJIA MaxDDs during the 126 trading days after 58 death and 58 golden crosses over the sample period. Results confirm those in the first chart above that drawdowns during the six months after death crosses tend to be somewhat deeper than those after golden crosses. The average 126-day MaxDD is about -7.3% after death crosses and -6.1% after golden crosses.
Next, we look at signal-to-signal (death cross-to-golden cross, and golden cross-to-death cross) DJIA behaviors.
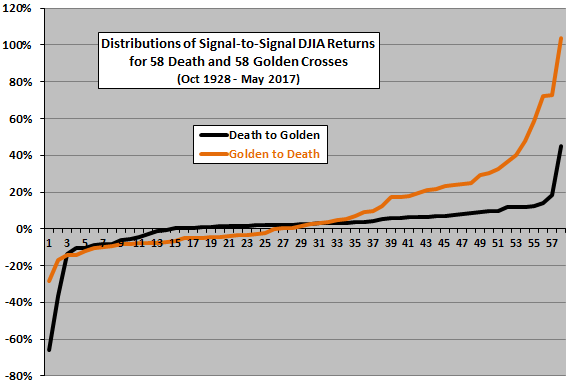
The next chart shows distributions of terminal DJIA returns for the 58 death cross-to-golden cross intervals and the 58 golden cross-to-death cross intervals in the sample period. The last golden cross-to-death cross interval is partial only, arbitrarily ended at the end of May 2017. While death cross-to-golden cross intervals have a higher percentage of positive returns, many golden cross-to-death cross returns are very large. A few statistics are:
- Terminal returns are positive 76% of the time after death crosses and 57% of the time after golden crosses.
- For positive (negative) outcomes, average return is +6.3% (-13.1%) after death crosses and +24.1% (-8.3%) for golden crosses.
- Average (median) terminal returns are 1.6% (2.5%) after death crosses and 10.1% (2.1%) after golden crosses. Standard deviations of terminal returns are 13.5% after death crosses and 24.5% after golden crosses.
However, golden cross-to-death cross intervals are on average much longer than death cross-to-golden cross intervals (1.4 years versus 0.8 years). To normalize, we look at returns per day.
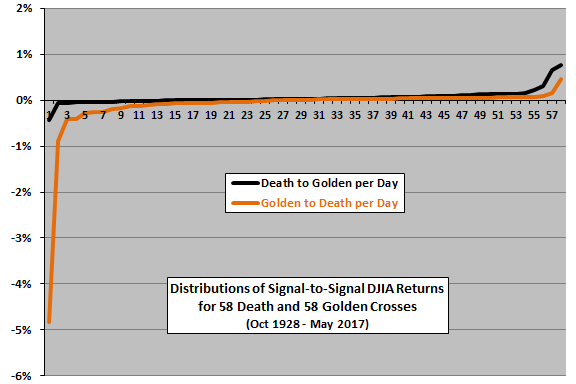
The next chart shows distributions of terminal DJIA returns per day for the 58 death cross-to-golden cross intervals and the 58 golden cross-to-death cross intervals in the sample period. Intervals are as short as one day. On a per-day basis, death cross-to-golden cross intervals compare favorably with golden cross-to-death cross intervals, suggesting that going to cash or shorting during the former is unproductive on average.
For another perspective, we look at the distributions of MaxDDs during death cross-to-golden cross intervals and golden cross-to-death cross intervals.
The next chart shows the distributions of DJIA MaxDDs during 58 death cross-to-golden cross intervals and 58 golden cross-to-death cross intervals. While MaxDD is not often severe during death cross-to-golden cross intervals (some of which are very short), the worst drawdowns in the sample period occur under these conditions. The average MaxDD is -12.0% after death crosses and -11.1% after golden crosses. The worst drawdowns occur after the death crosses of September 1937 (-40%), January 2008 (-50%) and November 1929 (-86%).
As a robustness test, we repeat the above analyses for the S&P 500 Index since 1950.

There are 34 death crosses and 34 golden crosses in the S&P 500 Index sample, less than one per year of each kind.
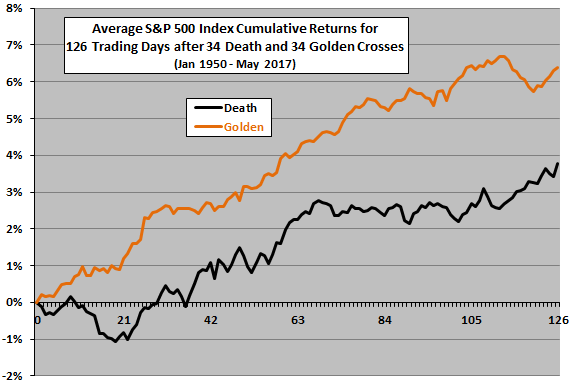
The next chart shows average cumulative return profiles for the S&P 500 Index during (1) the 126 trading days after the 34 death crosses in the sample and (2) the 126 trading days after the 34 golden crosses in the sample. In contrast to the results for DJIA, the index is on average generally substantially stronger after golden crosses than after death crosses.
A few measurement intervals overlap because signals are less than six month apart.
For another perspective, we look at the distributions of returns at the end of 126 trading days after death and golden crosses.
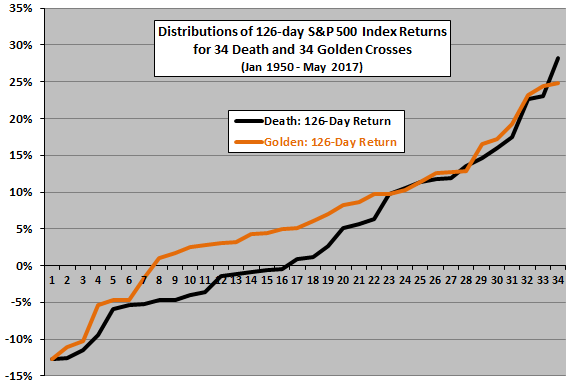
The next chart shows the distributions of 126-day terminal returns for the S&P 500 Index after 34 death crosses and 34 golden crosses over the sample period. Results show that the index tends to perform better after golden crosses than after death crosses.
A few statistics are:
- After 126 trading days, terminal returns are positive 52% of the time after death crosses and 79% of the time after golden crosses.
- For positive (negative) outcomes, average return is +10.9% (-5.3%) after death crosses and +9.3% (-7.2%) for golden crosses.
- Average (median) terminal returns are 3.8% (1.0%) after death crosses and 6.4% (5.6%) after golden crosses. Standard deviations of terminal returns are 10.6% after death crosses and 9.6% after golden crosses.
For yet another perspective, we look at the distributions of MaxDDs for the S&P 500 Index during the 126 trading days after death and golden crosses.
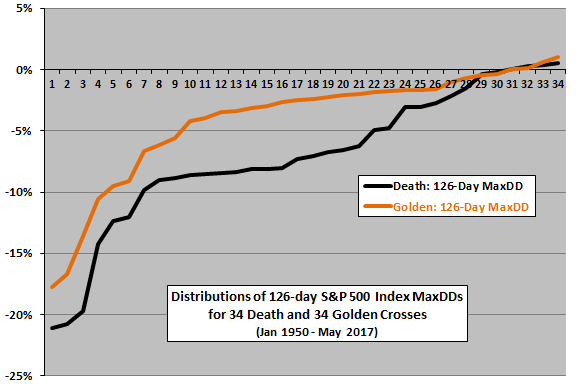
The next chart shows the distributions of S&P 500 Index MaxDDs during the 126 trading days after 32 death and 32 golden crosses over the sample period. Results show that drawdown risk is higher during death cross-to-golden cross intervals than golden cross-to-death cross intervals. The average 126-day MaxDD is -7.3% after death crosses and -4.3% after golden crosses.
Next, we look at signal-to-signal (death cross-to-golden cross, and golden cross-to-death cross) S&P 500 Index behaviors.
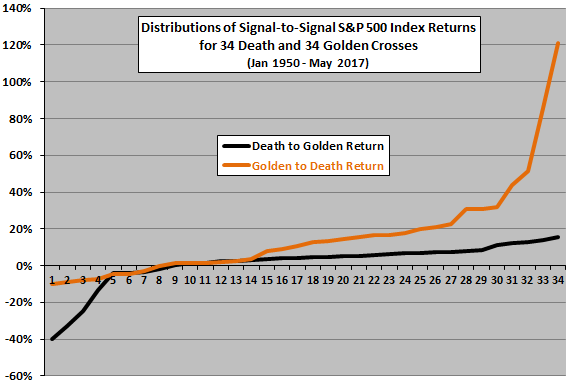
The next chart shows distributions of terminal S&P 500 Index returns for the 34 death cross-to-golden cross intervals and the 34 golden cross-to-death cross intervals in the sample period. The last golden cross-to-death cross interval is partial only, arbitrarily ended at the end of May 2017. In general, returns are much more attractive for golden cross-to-death cross intervals than for death cross-to-golden cross intervals. A few statistics are:
- Terminal returns are positive 76% of the time after death crosses and 76% of the time after golden crosses.
- For positive (negative) outcomes, the average return is +6.4% (-15.6%) after death crosses and +23.2% (-5.8%) for golden crosses.
- Average (median) terminal returns are 1.2% (4.3%) after death crosses and 16.4% (12.0%) after golden crosses. Standard deviations of terminal returns are 12.2% after death crosses and 26.9% after golden crosses.
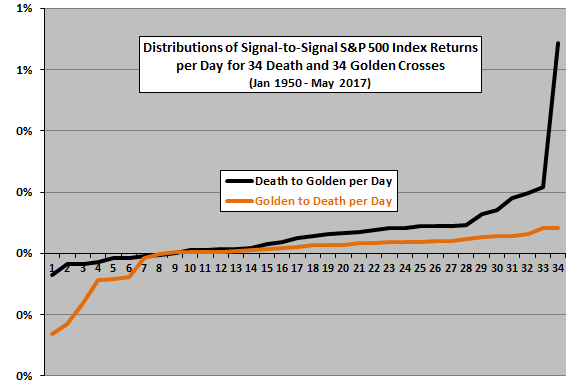
However, as for DJIA, golden cross-to-death cross intervals are on average much longer than death cross-to-golden cross intervals (1.9 years versus 0.9 years). To normalize, we look at returns per day.
The next chart shows distributions of terminal S&P 500 Index returns per day for the 34 death cross-to-golden cross intervals and the 34 golden cross-to-death cross intervals in the sample period. Intervals are as short as one day. On a per-day basis, death cross-to-golden cross intervals compare favorably with golden cross-to-death cross intervals, suggesting that going to cash or shorting during the former is unproductive on average.
For another perspective, we look at the distributions of MaxDDs during death cross-to-golden cross intervals and golden cross-to-death cross intervals.
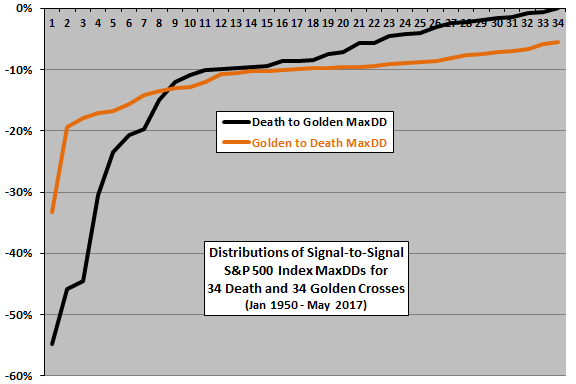
The final chart shows the distributions of S&P 500 Index MaxDDs during 32 death cross-to-golden cross intervals and 31 golden cross-to-death cross intervals. While MaxDD is not often severe during death cross-to-golden cross intervals (some of which are very short), the worst drawdowns in the sample period occur during these times. The average MaxDD is about -12.3% after death crosses and -11.6% after golden crosses. The worst drawdowns occur after the death crosses of April 1973 (-44%), October 2000 (-46%) and December 2007 (-55%).
In summary, evidence from simple tests on available data indicate that the death cross and golden cross nomenclature is overly dramatic. Killer crashes are uncommon after death crosses (but do occur).
It appears that some other information is necessary to distinguish between mild and severe drawdowns after death crosses.
Cautions regarding findings include:
- Sample sizes for death crosses and golden crosses are not large, especially for the S&P 500 Index, limiting confidence in findings.
- As noted, some 126-day intervals after crossing signals overlap, potentially distorting statistics.
- Analyses do not account for normal dividends, which would favor longer golden cross-to-death cross intervals over shorter death cross-to-golden cross intervals.
- DJIA and the S&P 500 Index are not independent, so the value of robustness tests is more the different sample periods than the different asset proxies. Findings for other kinds of assets may be very different.
- Findings may inform tactical asset allocation strategies, but do not include tests of any particular strategies. But see “Selling Calls or Puts According to Trend”.