A subscriber asked for an update on the effectiveness of applying a two-period Relative Strength Index, RSI(2), to leveraged exchange-traded funds (ETF), with two pairs of trade entry (oversold) and exit (overbought) settings:
- Buy when RSI(2) falls below 10 and sell when it subsequently rises over 90 (10-90).
- More conservatively, buy when RSI(2) falls below 5 and exit when it subsequently rises over 70 (5-70).
To investigate, we run simple tests on ProShares Ultra S&P 500 (SSO) with RSI(2) calculations based on the RSI template from StockCharts. Using daily adjusted SSO opens and closes during July 2006 (the first full month SSO is available) through October 2019, we find that:
Calculations assume that:
- Trades occur either at the next open after, or at the same close as, RSI(2) calculations.
- Start with the first buy signal common to the two rule pairs (8/9/2006). End with the last sell signal for either pair (10/15/2019).
- Baseline two-way (buy and sell) trading frictions are 0.1%, with a sensitivity test.
- Return on cash when not in SSO is zero (close to correct for much of the sample period).
- There are no tax implications of trading.
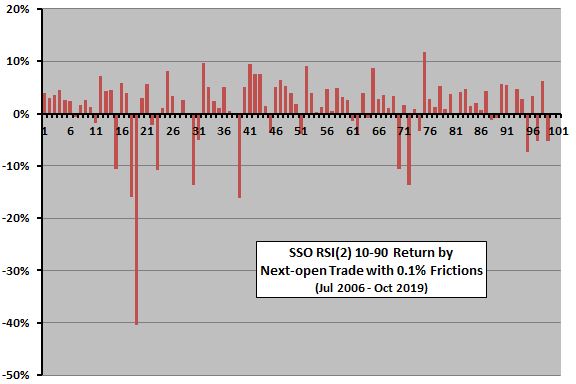
The following chart summarizes return by trade for the 101 trades generated by RSI(2) 10-90 over the sample period based on trading at the next open after signals. Average trade duration is about 19 days. Some trade statistics are:
- Average return: 1.0%.
- Standard deviation of returns: 6.7%.
- Percentage of winning trades: 72%.
- Worst loss: -40.4% during September-November 2008.
- Percentage of time in SSO: 40%.
This version of the strategy generates mostly positive returns with occasional crashes. Results for trading at the same close as RSI(2) calculations are a little weaker.
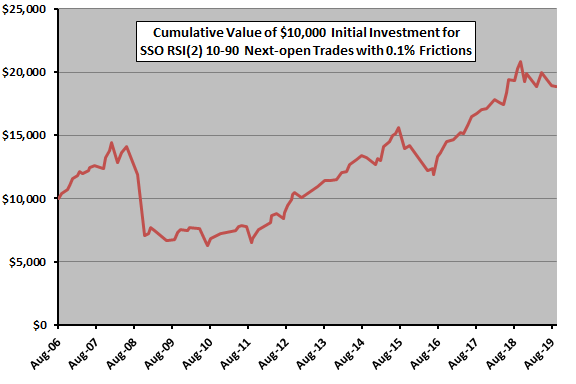
For another perspective, we look at cumulative effect of trading.
The next chart shows the effect on a $10,000 initial investment of the 101 trades generated by RSI(2) 10-90 over the sample period based on trading at the next open after signals. The compound annual growth rate (CAGR) is 4.9%, compared with 11.6% for buying and holding SSO.
Results for trading at the same close as RSI(2) calculations are a little weaker, with CAGR 4.5%.
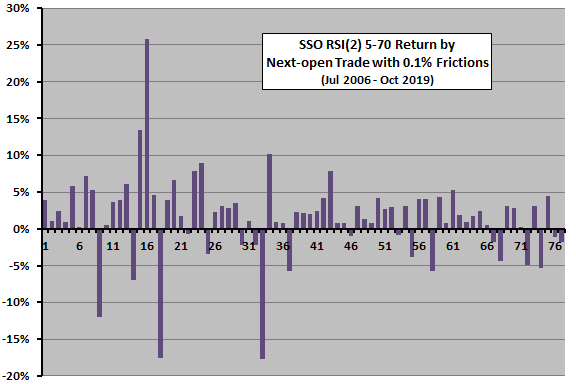
What about the more conservative entry/exit settings?
The next chart summarizes return by trade for the 77 trades generated by RSI(2) 5-70 over the sample period based on trading at the next open after signals. Average trade duration is about 7 days. Some trade statistics are:
- Average return: 1.6%.
- Standard deviation of returns: 5.8%.
- Percentage of winning trades: 77%.
- Worst loss: -17.7% during July-August 2011.
- Percentage of time in SSO: 11%.
This version of the strategy also generates mostly positive returns with occasional crashes. Results for trading at the same close as RSI(2) calculations are again weaker.
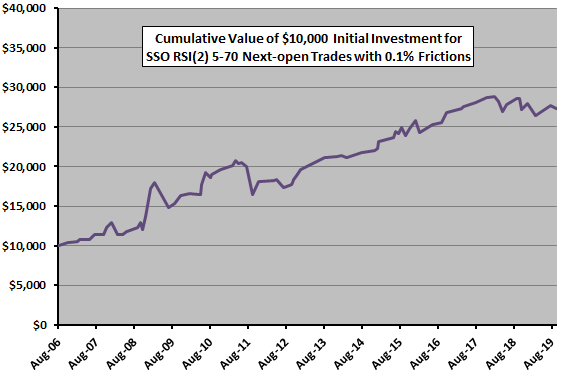
Again, for another perspective, we look at cumulative effect of trading.
The next chart shows the effect on a $10,000 initial investment of the 68 trades generated by RSI(2) 5-70 over the sample period based on trading at the next open after signals. CAGR is 7.7%, compared with 11.6% for buying and holding SSO.
Results for trading at the same close as RSI(2) calculations are weaker, with CAGR 6.4%.
RSI(2) 5-70 is more attractive than RSI(2) 10-90. However, trying different entry and exit settings introduces data snooping bias, such that the best-performing version overstates expectations. There may be additional unquantifiable snooping bias derived from experimentation by others to decide the settings suggested for these tests.
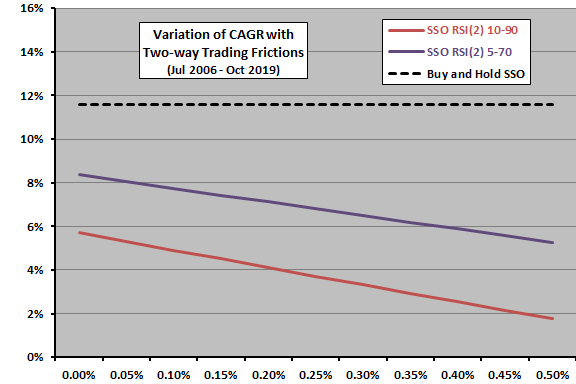
How sensitive are findings to the assumed level of trading frictions?
The final chart shows how CAGRs for RSI(2) 10-90 and RSI(2) 5-70 vary with assumed level of two-way trading frictions based on trading at the next open after signals. For comparison, the chart also shows CAGR for buying and holding SSO.
Both RSI(2) strategies have substantially lower CAGRs than buying and holding SSO regardless of level of trading frictions. As indicated above, 10-90 underperforms 5-70.
It is plausible that SSO bid-ask spread widens during extreme oversold/overbought conditions, such that assuming low trading frictions is unrealistic.
In summary, evidence from simple tests indicates that RSI(2) signals applied to SSO produce a high win rate, but occasionally suffer large losses and are not attractive as a standalone strategy over the long run.
Cautions regarding findings include:
- As noted, testing both 10-90 and 5-70 variations with trades at either open or close introduces explicit data snooping bias into findings, such that the best combination overstates expectations. And, there may be inherited snooping bias in these settings.
- Different RSI calculation templates, other thresholds for entering and exiting trades and addition of rules to limit crashes may affect findings. However, experimentation incorporates further snooping bias (luck) into strategies with the best results, thereby overstating performance expectations.
- As noted, calculations ignore return on cash (low during the sample period) and tax implications of trading.