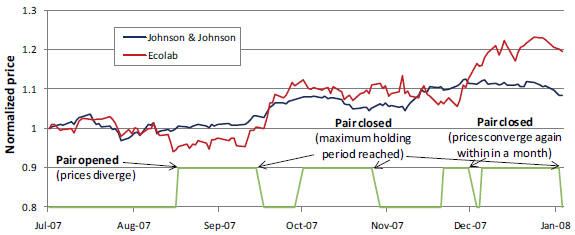
Is stock pairs trading particularly successful under predictable conditions? In their December 2014 paper entitled “On the Determinants of Pairs Trading Profitability”, Heiko Jacobs and Martin Weber present a large-scale analysis of pairs trading, evaluating the effects on profitability of the type of news driving pair divergence, the level of available investor attention and obstacle to exploitation (limits of arbitrage). Their pairs trading approach (see the first chart below as an example) employs daily stock price data to:
- Calculate each month normalized total return trajectories of stocks over the past 12 months.
- Measure differences in trajectories for all possible stock pairs.
- Select the 100 pairs with minimum differences and re-normalize their prices.
- Whenever over the next six months a pair diverges by more than two standard deviations (per the above 12-month interval), buy the underpriced stock and sell the overpriced stock after a one-day delay.
- Close the positions upon price convergence within the next month with a one-day delay. If prices do not converge, close the positions after one month. A pair may trade several times during the six-month trading period.
Using stock return data from 34 countries during 2000 through 2013 (excluding small and illiquid firms) and a sample of U.S. stocks with greater than median capitalizations during 1962 through 2008 with contemporaneous news, investor attention and cost of trading proxies, they find that:
- For the recent international sample:
- The average monthly gross return is 0.72%, with three-factor (market, size, book-to-market) monthly gross alpha 0.63%.
- Gross abnormal returns are relatively strong in emerging markets and markets with high idiosyncratic volatility (suggesting limits to arbitrage).
- Gross abnormal returns are also relatively strong in markets with large numbers of potential pairs (suggesting limited available investor attention).
- For the longer U.S. sample:
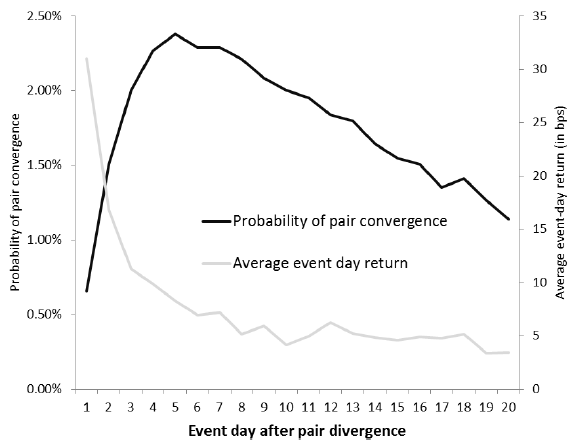
- The average monthly gross return is about 1%, with multi-factor monthly gross alphas around 1.3%. Profitability derives largely from the 36.2% of pairs that converge within a month. Probability of convergence peaks at about one week (see the second chart below).
- There is considerable variation in profitability over time, even within each year. Analysis of three equal subperiods suggests a negative trend in profitability, but returns are
significant in each subperiod. - Results are generally robust to exclusion of utility firms and changes in rules for identifying pairs.
- Pairs that diverge on days with macroeconomic rather than firm-specific news tend to exhibit higher gross profitability.
- Pairs trading gross profitability relates negatively to available investor attention. For example, gross monthly return is at least 0.9% higher during economic recessions than expansions and during times of high absolute investor sentiment than times of low absolute sentiment.
- Limits to arbitrage on the day of divergence are important drivers of gross returns. For example, pairs of stocks with high idiosyncratic risk or low liquidity produce considerably more profitable trades than pairs with low risk or high liquidity. More globally, a one standard deviation increase in the average bid-ask spread relates to a 0.3% increase in gross monthly profitability.
The following chart, taken from the paper, illustrates the pairs trading strategy described above. At the beginning of the trading period, prices of pair constituents are set to one. Whenever the gap between the two cumulative return series exceeds two historical standard deviations, take a long (short) position in the relatively underpriced (overpriced) stock with a one-day delay. Hold the paired positions until convergence (again with a one-day delay) or one month, whichever occurs first.

The next chart, also from the paper, shows the probability of diverged U.S. stock pairs converging over the month after divergence (black line) as well as the average daily return of open pairs (light grey line) based on 103,386 round-trip trades during 1962 through 2008. The greatest likelihood of convergence and the largest profits typically occur during the first few days after divergence.

In summary, evidence indicates that stock pairs trading is attractive on a gross basis across equity markets, with (1) type of news preceding pair divergence (macroeconomic rather than firm-specific), (2) available investor attention (low rather than high), and (3) obstacles to exploitation (high rather than low) important drivers of gross profitability.
Cautions regarding findings include:
- Reported returns and alphas are gross, not net. Incorporating trading frictions and shorting costs would reduce these returns. Shorting may be not be feasible for all trades included.
- There may be changes in the U.S. stock trading environment since end of 2008 (increasing speed) that affect pairs trading profitability.
- As implied in the paper, there may be times when there are many good pairs trading opportunities and other times when there are few good opportunities.
- Some investors may not be able to hold enough pairs to support a statistically confident outcome.