What is the best way to implement a value strategy for U.S. stocks? In their May 2015 paper entitled “Optimizing Value”, Ran Leshem, Lisa Goldberg and Alan Cummings investigate how the choice of value metric and implementation approach affect value strategy performance. They first compare book value-to-price ratio (B/P) and earnings-to-price ratio (E/P) based on returns for portfolios of the top 30% of stocks based on each metric, reformed frictionlessly each month since 1951. They then compare practical implementations that reform portfolios of S&P 500 stocks quarterly since 1973 (with round-trip trading friction 0.12%) by: (1) selecting the top 30% stocks based on the value metrics; or, (2) tilting S&P 500 Index weights based on the metrics. Finally, they add constraints to avoid value portfolio sector concentrations. Using Ken French’s value factor data since 1951 and data for S&P 500 stocks since 1973, both through December 2013, they find that:
- Based on Ken French’s factor data during 1951-2013, portfolios that each month select the top 30% of stocks based on B/P and E/P deliver average annual gross value premiums of 3.2% and 4.4%, respectively.
- Over the entire sample period, E/P beats B/P based on average annual gross return (16.0% versus 14.8%) and standard deviation of annual returns (15.7% versus 16.1%).
- However, B/P outperforms E/P during 1963-1990 and thereby became an academic standard.
- Based on S&P 500 stock data during 1973-2013, portfolios that each quarter select the top 30% of stocks based on B/P and E/P (with round-trip trading friction 0.12%) deliver net compound annual growth rates (CAGR) of 12.8% and 13.5%, respectively, compared to 10.3% for the index.
- Corresponding net annual Sharpe ratios are 0.44, 0.52 and 0.35, respectively.
- A strategy based on a blended 50% B/P-50% E/P signal outperform both single-metric strategies overall (CAGR 14.2% and Sharpe ratio 0.53) and during most rolling 10-year intervals.
- Alternatively, tilting an S&P 500 stock portfolio moderately toward value stocks to achieve an index tracking error of 2-4%:
- Lowers net annual Sharpe ratios to 0.41, 0.48 and 0.49 for B/P, E/P and the blended metric, respectively.
- Reduces benchmark tracking error by more than half.
- Reduces portfolio turnover by about a factor of three.
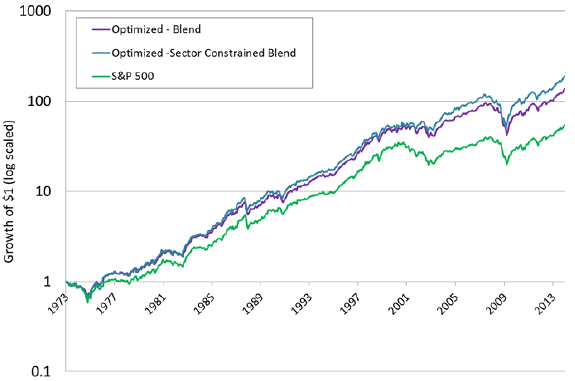
- Constraining an S&P 500 stock portfolio that tilts moderately toward the blended value metric to stay within +/- 1% of the sector exposures of the benchmark index boosts net annual Sharpe ratio to 0.54 (see the chart below).
The following chart, taken from the paper, tracks net cumulative values of $1 initial investments at the beginning of January 1973 in three portfolios:
- Optimized – Blend: an S&P 500 stock portfolio tilted moderately toward value stocks to achieve an index tracking error of 2-4%.
- Optimized Sector Constrained Blend: adding to Optimized – Blend a constraint to stay within +/- 1% of the sector exposures of the benchmark index.
- S&P 500: the capitalization-weighted benchmark.
Results show that, with low round-trip trading frictions of 0.12%, the value strategies outperform the benchmark index consistently.
In summary, evidence indicates that value strategies applied to U.S. stocks outperform the market when portfolio trading frictions are low, with a blended value metric generally outperforming individual metrics and value tilts competitive with pure value.
Cautions regarding findings include:
- Assumed round-trip trading frictions of 0.12% for S&P 500 stocks are very low for large parts of sample periods and for individuals generally.
- As noted in the paper, outcomes ignore any fees that a fund manager would charge to maintain specified portfolios.
- Testing many strategies on the same data introduces snooping bias, such that the best-performing strategy likely overstates expectations. There may be incremental snooping bias (both inherent and inherited from prior research) in selecting strategy features such as specific value metrics and optimization/constraint parameter settings.